. 2024 Nov 26;15(1):10232.
doi: 10.1038/s41467-024-54145-w.

Spatial transcriptomics reveals substantial heterogeneity in triple-negative breast cancer with potential clinical implications

Affiliations

Spatial transcriptomics reveals substantial heterogeneity in triple-negative breast cancer with potential clinical implications

Xiaoxiao Wang et al. Nat Commun. .

Abstract

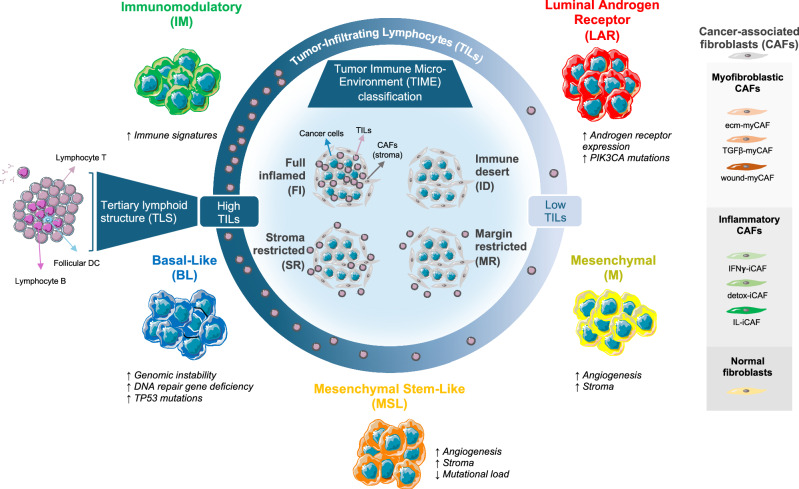
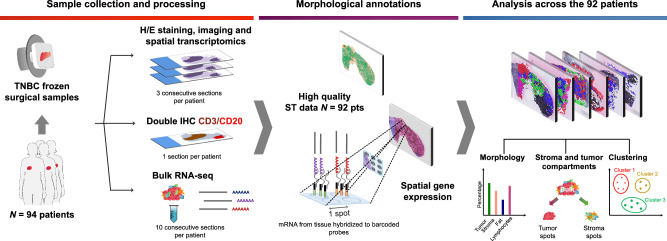
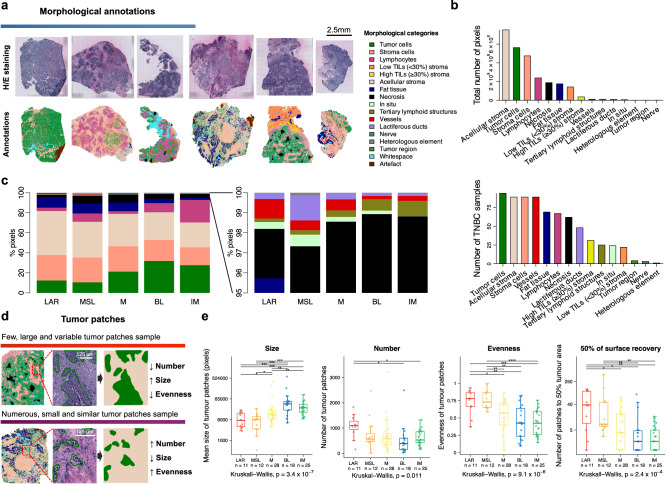
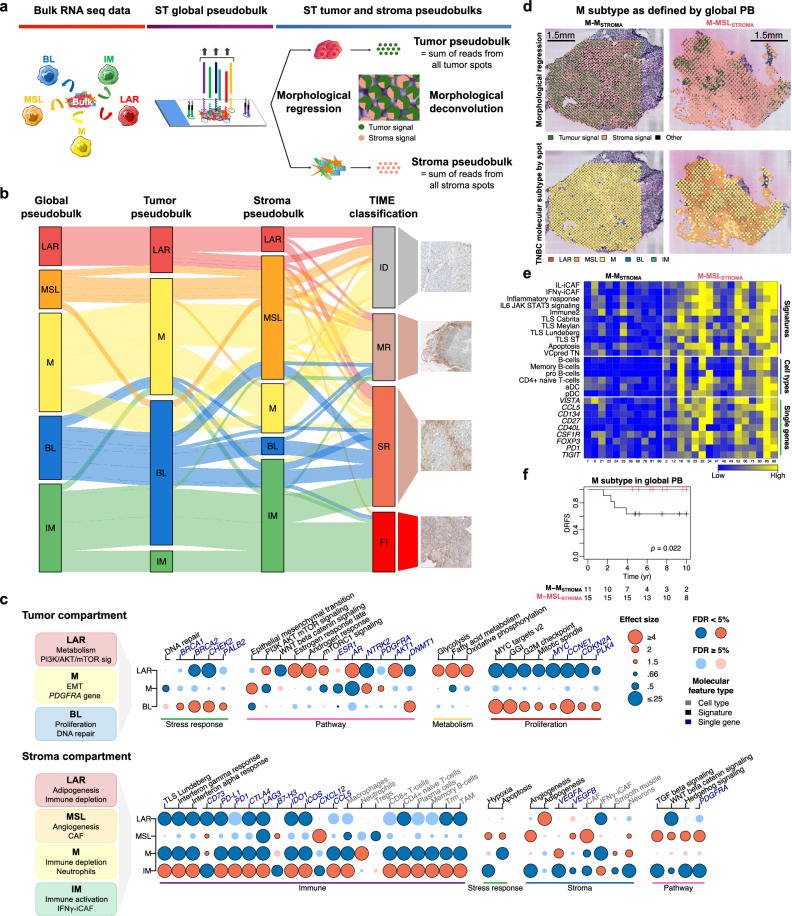
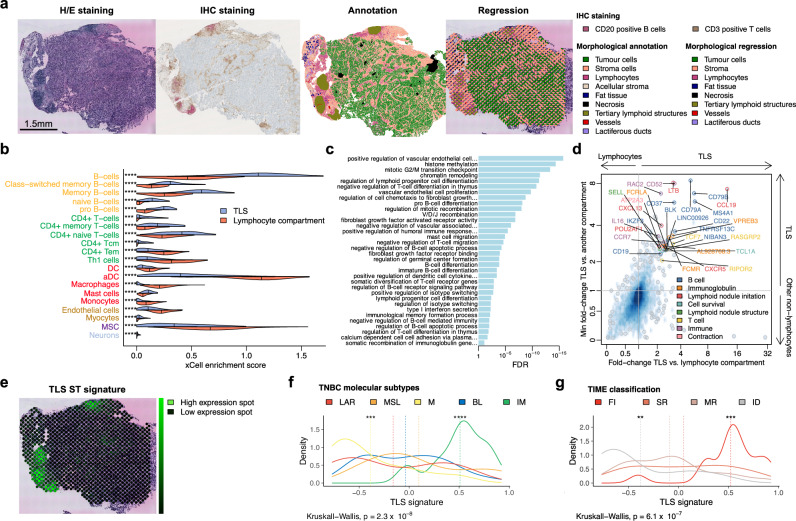
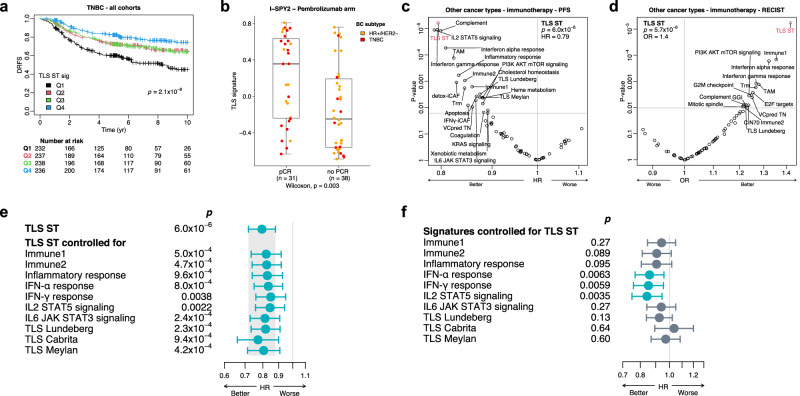
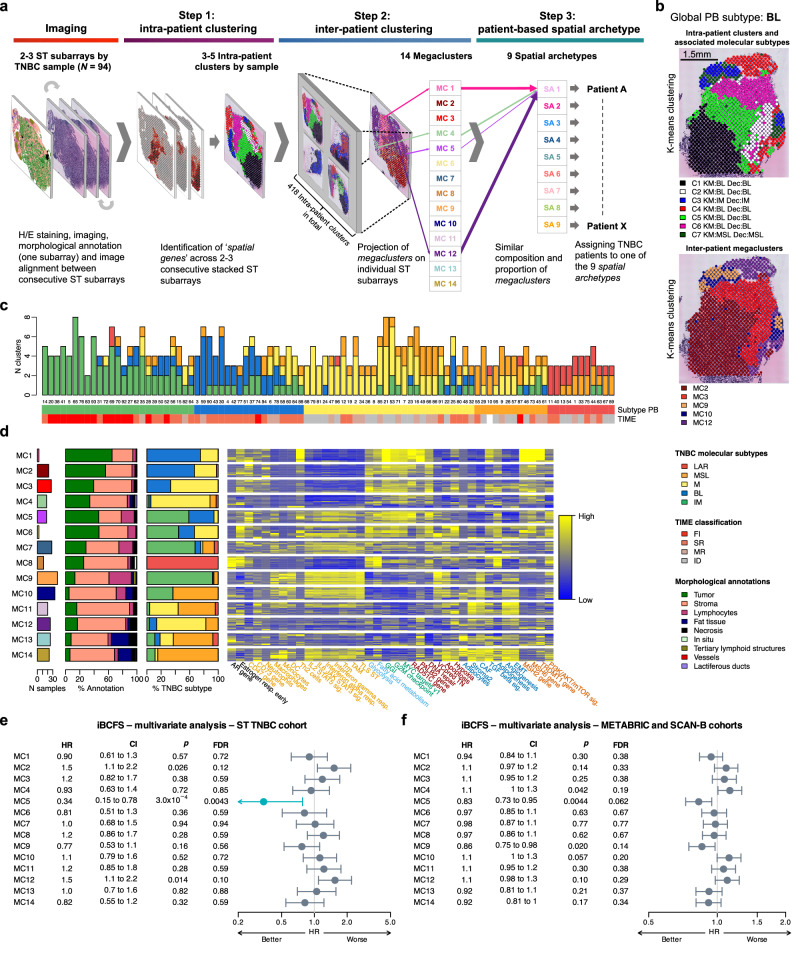
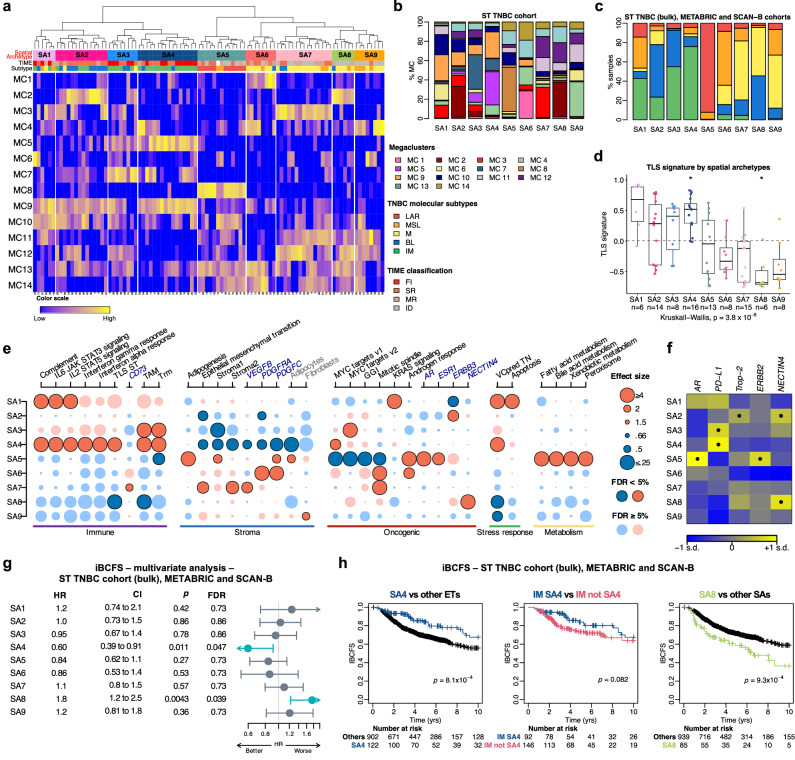
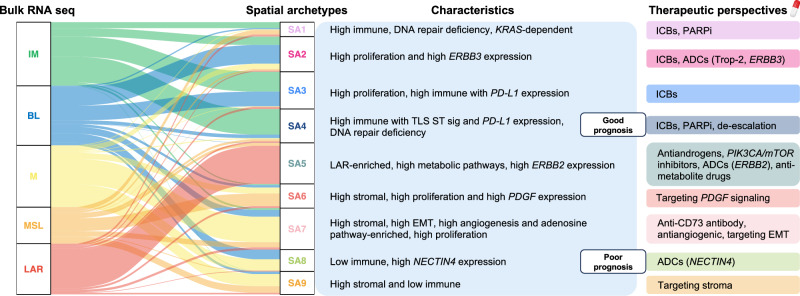
While triple-negative breast cancer (TNBC) is known to be heterogeneous at the genomic and transcriptomic levels, spatial information on tumor organization and cell composition is still lacking. Here, we investigate TNBC tumor architecture including its microenvironment using spatial transcriptomics on a series of 92 patients. We perform an in-depth characterization of tumor and stroma organization and composition using an integrative approach combining histomorphological and spatial transcriptomics. Furthermore, a detailed molecular characterization of tertiary lymphoid structures leads to identify a gene signature strongly associated to disease outcome and response to immunotherapy in several tumor types beyond TNBC. A stepwise clustering analysis identifies nine TNBC spatial archetypes, further validated in external datasets. Several spatial archetypes are associated with disease outcome and characterized by potentially actionable features. In this work, we provide a comprehensive insight into the complexity of TNBC ecosystem with potential clinical relevance, opening avenues for treatment tailoring including immunotherapy.


Conflict of interest statement

Competing interests: J.L., S.S., K.T., E.G.V. and N.B. are scientific advisors for 10xGenomics Inc. The remaining authors declare no competing interests.

Figures

Fig. 1
Fig. 1. Overview of tumor heterogeneity in triple-negative breast cancer.
Previous studies using bulk RNA seq analysis of TNBC patients have identified five molecular subtypes: luminal androgen receptor, mesenchymal, mesenchymal stem-like, basal-like, and immunomodulatory. These subtypes are associated with distinct tumor microenvironments, characterized by variations in the rate of tumor-infiltrating lymphocytes, spatial immune organization (TIME classification), the presence or absence of tertiary lymphoid structures, and different types of cancer-associated fibroblasts. Figure 1 was partly generated using Servier Medical Art, provided by Servier (https://smart.servier.com/), licensed under Attribution 4.0 International License (https://creativecommons.org/licenses/by/4.0/). BL basal-like, CAF cancer-associated fibroblast, detox-iCAF detoxification pathway inflammatory cancer-associated fibroblast S1, ecm-myCAF extracellular matrix myofibroblastic cancer-associated fibroblast S1, DC dendritic cell, FI full inflamed, iCAF inflammatory cancer-associated fibroblast S1, ID immune desert, IFNγ-iCAF interferon gamma signaling pathway cancer-associated fibroblast S1, IL-iCAF IL pathway inflammatory cancer-associated fibroblast S1, IM immunomodulatory, LAR luminal androgen receptor, M mesenchymal, MR margin restricted, MSL mesenchymal stem-like, myCAF myofibroblastic cancer-associated fibroblast, SR stroma restricted, TGFβ-myCAF TGFbeta signaling pathway myofibroblastic cancer-associated fibroblast S1, TILs tumor-infiltrating lymphocytes, TIME Tumor Immune Micro-Environment, TLS tertiary lymphoid structure, wound-myCAF wound healing myofibroblastic cancer-associated fibroblast S1.
Fig. 2
Fig. 2. Study design.
Overview of the ST workflow: from patient to data analysis. ST analysis was conducted in triplicates on fresh-frozen surgical samples from 94 TNBC patients. Double CD3/CD20 IHC and bulk RNA sequencing were performed for each patient. Detailed morphological annotation was carried out on one of the available ST sections. Bioinformatic analyses integrated morphological features and ST sequencing data. Figure 2 was partly generated using Servier Medical Art, provided by Servier (https://smart.servier.com/), licensed under Attribution 4.0 International License (https://creativecommons.org/licenses/by/4.0/). H/E hematoxylin and eosin, IHC immunohistochemistry, ST spatial transcriptomics, TNBC triple-negative breast cancer.
Fig. 3
Fig. 3. Morphological analyses.
a Morphological annotation into fifteen histomorphological categories for one H/E-stained slide from the ST sections of each TNBC sample (right, color code). b Total number of pixels for each annotated histomorphological category (top) and the number of samples containing the different categories (bottom) (N = 94). c Distribution of morphological annotations across the five TNBC molecular subtypes, computed using ST global pseudobulk data (N = 94). d Illustration of distinct tumor patch patterns characterized by size, number, and diversity index (evenness). e Distribution of tumor patch metrics by TNBC molecular classification (N = 94). Statistical differences across subtypes were assessed using Kruskal–Wallis tests and Wilcoxon rank sum test (when comparing each subtype to each of the others). For Wilcoxon tests, FDRs were obtained by adjusting two-sided P values using Benjamini & Hochberg method (*FDR < 0.05 and ≥0.01, **FDR < 0.01 and ≥0.001, ***FDR < 0.001 and ≥0.0001, ****FDR < 0.0001). In boxplots, the boxes are defined by the upper and lower quartile; the median is shown as a bold colored horizontal line; whiskers extend to the most extreme data point which is no more than 1.5 times the interquartile range from the box. Source data and exact P values are provided as a Source Data file. BL basal-like, FDR false-discovery rate, H/E hematoxylin and eosin, IM immunomodulatory, LAR luminal androgen receptor, M mesenchymal, MSL mesenchymal stem-like, TNBC triple-negative breast cancer.
Fig. 4
Fig. 4. Spatial deconvolution of TNBC molecular subtypes.
a Three levels of gene expression data: RNA sequencing from bulk tumors, ST global pseudobulk (captured from all ST spots), and ST tumor (green) and stroma (pink) pseudobulks (or compartments). b Contribution of tumor and stroma compartments to the TNBC molecular subtypes (N = 94). The alluvial plot shows the distribution of TNBC subtypes from ST global, tumor, and stroma pseudobulks, along with the spatial immunophenotypes (TIME classification). c Molecular and cellular characterization of tumor (top) and stroma (bottom) compartments across TNBC subtypes (N = 94). The most relevant and significant molecular and cellular features, including single gene expression, gene signatures, and xCell enrichment, are illustrated. FDRs are based on the Wilcoxon rank-sum test. FDR < 0.05 shown with dark-bordered dots; blue = negative association, red = positive association. Full effect sizes (by logistic regression) and FDRs are in Supplementary Fig. 3a, b. d Examples of the M subtype associated with either M (left) or MSL (right) stroma. Morphological regression shows the spatial distribution of tumor (green) and stroma (pink) signals. TNBC molecular classification is projected at the ST spot level. e Heatmap of molecular and cellular features characterizing the M subtype with M (left) (N = 11) or MSL (right) (N = 16) stroma (FDR < 0.05). f Kaplan–Meier plot of DRFS in patients with M subtype and either MSL or M stroma (N = 26). P value obtained using the permutation version of the log-rank test. Source data are provided as a Source Data file. Figure 4a was partly generated using Servier Medical Art, provided by Servier (https://smart.servier.com/), licensed under Attribution 4.0 International License (https://creativecommons.org/licenses/by/4.0/). BL basal-like, FDR false-discovery rate, CAF cancer-associated fibroblast, DRFS distant relapse-free survival, EMT epithelial-mesenchymal transition, FI full inflamed, GGI genomic grade index, ID immune desert, IFNγ-iCAF interferon gamma signaling pathway cancer-associated fibroblast S1, IM immunomodulatory, IL-iCAF IL pathway inflammatory cancer-associated fibroblast S1, LAR luminal androgen receptor, M mesenchymal, MR margin restricted, MSL mesenchymal stem-like, PB pseudobulk, SR stroma restricted, ST spatial transcriptomics, TAM tumor associated macrophages, TIME Tumor Immune Micro-Environment, TLS tertiary lymphoid structure, Tregs regulatory T cells, Trm tissue-resident memory T cell.
Fig. 5
Fig. 5. Spatial characterization of tertiary lymphoid structures and development of a 30-gene TLS ST signature.
a Illustrative sample (ST_TNBC_ID 30) demonstrating TLS detection via CD3/CD20 IHC staining, along with morphological annotation of the H/E-stained ST slide (highlighted in khaki) and corresponding morphological regression (also in khaki). The same analyses were conducted across the entire cohort (except for IHC: N = 86), with regression performed on duplicates or triplicates of each ST sample. b Cell-type enrichment by xCell in TLS compared to the lymphocyte compartment in the ST TNBC cohort (N = 94). Median values are indicated by vertical lines. Only FDRs <0.05 are reported using two-sided Wilcoxon rank sum test. c Selected enriched biological pathways identified by GO: BP in TLS compared to the lymphocyte compartment in the ST TNBC cohort. Only FDRs <0.05 are reported using one-sided Wilcoxon rank sum test. d Scatter plot displaying 30 differentially expressed genes from the comparison of TLS with either lymphocyte (x-axis) or other non-lymphocyte compartments (y axis), composing the TLS ST signature in the ST TNBC cohort (N = 94). e Projection of the TLS ST signature expression (neon green) on the same TNBC sample (ST_TNBC_ID 30). f, g Distribution of TLS ST signature expression across TNBC molecular subtypes (N = 94) (f) and TIME classification (N = 93) (g) in the ST TNBC cohort. Dashed lines represent the mean signature by subgroup. Two-sided P values are from Kruskal–Wallis tests and Wilcoxon rank-sum tests (for comparisons of each class to all classes). FDRs were calculated using the Benjamini & Hochberg method to adjust P values (*FDR < 0.05 and ≥0.01; **FDR < 0.01 and ≥0.001; ***FDR < 0.001 and ≥0.0001; ****FDR < 0.0001). Source data and exact P values are provided as a Source Data file. aDC activated dendritic cells, BL basal-like, DC dendritic cells, FDR false-discovery rate, FI full inflamed, H/E hematoxylin and eosin, ID immune desert, IHC immunohistochemistry, IM immunomodulatory, LAR luminal androgen receptor, M mesenchymal, MR margin restricted, MSC mesenchymal stem cell, MSL mesenchymal stem-like, SR stroma restricted, Tcm central memory T cells, Tem effector memory T cells, Th1 type 1 helper, TIME Tumor Immune Microenvironment, TLS tertiary lymphoid structure.
Fig. 6
Fig. 6. Prognostic and predictive value of the 30-gene TLS ST signature.
a Kaplan-Meier plot showing DRFS according to TLS ST signature quartiles in combined TNBC cohorts: ST TNBC (N = 92), METABRIC (N = 334), and SCAN-B (N = 518). The two-sided P value was obtained using the likelihood ratio test from a Cox regression stratified by study. b TLS ST signature levels by pCR status in TNBC (red) and luminal HR+/HER2− (orange) patients treated with paclitaxel plus pembrolizumab in I-SPY2 trial (N = 69). Two-sided P value was derived from the Wilcoxon test. Boxes represent the interquartile range (IQR), with the median shown as a bold horizontal line; whiskers extend to the most extreme data point within 1.5 times the IQR. c, d Predictions of PFS (N = 572) (c) and radiological response (RECIST) (N = 842) (d) using TLS ST signature and other reported signatures in metastatic non-breast cancers treated with immune checkpoint inhibitors. TLS ST signature: HR, FDR (p) for PFS (by Cox regression using log likelihood test, stratified by study) (c); OR, FDR (p) for RECIST (by logistic regression using Wald test, random effect by study) (d). FDR by Benjamini & Hochberg method to adjust two-sided P values. e Association of the TLS ST signature with PFS before and after adjusting for various immune signatures in metastatic non-breast cancers treated with immune checkpoint inhibitors (N = 572). f Association of different immune signatures with PFS after adjusting for the TLS ST signature in the same cohort (N = 572). Two-sided P values were derived from likelihood ratio tests on nested models. Significant P values (<0.05) are highlighted in blue. Circles represent HR, with error bars indicating the 95% confidence interval (CI). Source data are provided as a Source Data file. BC breast cancer, detox-iCAF detoxification pathway inflammatory cancer-associated fibroblast S1, DRFS distant relapse-free survival, GGI genomic grade index, HR hazard ratio, HR+ hormone receptor positive, IFNγ-iCAF interferon gamma signaling pathway cancer-associated fibroblast S1, OR odds ratio, PFS progression-free survival, Q1-4 quartiles 1–4, ST spatial transcriptomics, TAM tumor associated macrophages, TLS tertiary lymphoid structure, Trm tissue-resident memory T cell, VCpredTN veliparib carboplatin prediction triple negative.
Fig. 7
Fig. 7. Characterization of spatial molecular patterns.
a Overview of the 3-step approach for characterizing spatial molecular patterns shared across TNBC samples, leading to the identification of 14 megaclusters and 9 spatial archetypes. b Projection of intra-patient (top) and inter-patient (bottom) clusters in a representative BL subtype TNBC sample (ST_TNBC_ID 30). c Heterogeneity of intra-patient clusters based on TNBC molecular classification (N = 94). The TNBC molecular subtype was calculated using global pseudobulk (Subtype PB), with spatial immunophenotypes (TIME) also shown. d Morphological, molecular, and cellular characterization of the 14 megaclusters shared across TNBC patients (N = 94). The molecular subtypes of the 418 individual clusters are shown (% TNBC subtype). A heatmap of selected molecular features (single gene expression, gene signatures, and xCell cell type enrichment) specific to each megacluster is provided, with detailed analyses available in Supplementary Figs. 11b, c, 12, and 13. e, f Association of the 14 megaclusters with iBCFS in the ST TNBC cohort (N = 94) (e) and the combined METABRIC and SCAN-B cohorts (N = 1007) (f), using deconvolution of ST spots and RNA bulk expression, respectively. Analyses were adjusted for age, tumor size, and nodal status. Two-sided P values were derived from likelihood ratio tests on nested models, with significant FDRs (<0.05) shown in blue. Circles represent HR, and error bars indicate the 95% CI. Source data are provided as a Source Data file. BL basal-like, C1-C7 individual clusters 1–7, CAF cancer-associated fibroblast, CI confidence interval, DC dendritic cells, Dec deconvolution, EMT epithelial-mesenchymal transition, FDR false-discovery rate, FI full inflamed, GGI genomic grade index, HR hazard ratio, iBCFS invasive breast cancer-free survival, ID immune desert, IM immunomodulatory, KM K-means, LAR luminal androgen receptor, M mesenchymal, MC megacluster, MR margin restricted, MSL mesenchymal stem-like, PB pseudobulk, SA spatial archetype, SR stroma restricted, TAM tumor associated macrophages, Th2 type 2 helper, TIME Tumor Immune Micro-Environment, TLS tertiary lymphoid structure, TNBC triple-negative breast cancer, Trm tissue-resident memory T cell, VCpredTN veliparib carboplatin prediction triple negative.
Fig. 8
Fig. 8. Molecular and cellular characteristics of the nine spatial archetypes and their association with survival.
a Identification of the 9 SAs by hierarchical clustering of the 14 megaclusters. TNBC molecular subtypes and TIME spatial immunophenotypes are shown at the top. b Proportions of the 14 megaclusters within each SA in the ST TNBC cohort (global pseudobulk; N = 94). c Distribution of TNBC molecular subtypes across SAs in the combined TNBC cohorts (ST TNBC bulk, METABRIC, SCAN-B; N = 1101). d Distribution of the 30-gene TLS ST signature across SAs in the ST TNBC cohort. Two-sided P values are derived from Kruskal-Wallis and Wilcoxon rank-sum tests (one vs all). FDRs were calculated using the Benjamini & Hochberg method (*FDR < 0.05). Boxplots show quartiles, medians (bold line), and whiskers (1.5 times IQR). Dashed line indicates the mean TLS signature. e Molecular and cellular characterization of SAs in the ST TNBC cohort (N = 94), based on gene signatures, cell type enrichment, and single gene analysis. Dots are dark-colored when FDRs <0.05. Blue = negative, red = positive associations. Full details in Supplementary Fig. 20a, b, 21. f Expression of five targetable genes across SAs in combined TNBC cohorts (N = 1101). One-sided P values are derived from Wilcoxon rank sum test (one vs. all) and corrected for multiple testing. Positive associations (FDRs <10-5) are marked with dots; standard deviation labeled as “s.d.” g Association between SAs and iBCFS in the combined TNBC cohorts (N = 1101), adjusted for age, tumor size, and nodal status. Two-sided P values were derived from likelihood ratio tests on nested models, with significant FDRs (<0.05) shown in blue. Circles represent HR, and error bars indicate the 95% CI. h Kaplan-Meier plots showing iBCFS of SA4, IM in SA4, IM not SA4, and SA8 in the combined TNBC cohorts. P values from Cox regression stratified by study. Source data are available. BL basal-like, CI confidence interval, FDR false-discovery rate, FI full inflamed, GGI genomic grade index, HR hazard ratio, iBCFS invasive breast cancer-free survival, ID immune desert, IM immunomodulatory, LAR luminal androgen receptor, M mesenchymal, MC megacluster, MR margin restricted, MSL mesenchymal stem-like, SA spatial archetype, SR stroma restricted, TAM tumor associated macrophages, TIME Tumor Immune Microenvironment, TLS tertiary lymphoid structure, Trm tissue-resident memory T cell, VCpredTN veliparib carboplatin prediction triple negative.
Fig. 9
Fig. 9. Evolution of molecular subtypes in TNBC from bulk RNA seq analysis to ST-derived spatial archetypes.
Distribution of the five pre-existing TNBC molecular subtypes into different spatial archetypes in the ST TNBC (N = 94), METABRIC (N = 335) and SCAN-B (N = 672) cohorts. The molecular subtypes were defined from the ST global pseudobulk and from METABRIC and SCAN-B bulk transcriptomes. The main characteristics of each spatial archetype are summarized, highlighting the potential for precision medicine in TNBC with specific therapeutic strategies for each spatial archetype. Source data are provided as a Source Data file. ADC antibody-drug conjugate, BL basal-like, EMT epithelial-mesenchymal transition, ICB immune checkpoint blockade, IM immunomodulatory, LAR luminal androgen receptor, M mesenchymal, MSL mesenchymal stem-like, PARPi poly-ADP ribose polymerase inhibitor, SA spatial archetype, TLS tertiary lymphoid structures.

References

    1. Bauer, K., Parise, C. & Caggiano, V. Use of ER/PR/HER2 subtypes in conjunction with the 2007 St Gallen Consensus Statement for early breast cancer. BMC Cancer10, 228 (2010). - PMC - PubMed
    1. Dent, R. et al. Triple-negative breast cancer: clinical features and patterns of recurrence. Clin. Cancer Res.13, 4429–4434 (2007). - PubMed
    1. Foulkes, W. D., Smith, I. E. & Reis-Filho, J. S. Triple-negative breast cancer. N. Engl. J. Med.363, 1938–1948 (2010). - PubMed
    1. Symmans, W. F. et al. Long-term prognostic risk after neoadjuvant chemotherapy associated with residual cancer burden and breast cancer subtype. J. Clin. Oncol.35, 1049–1060 (2017). - PMC - PubMed
    1. Bianchini, G., Balko, J. M., Mayer, I. A., Sanders, M. E. & Gianni, L. Triple-negative breast cancer: challenges and opportunities of a heterogeneous disease. Nat. Rev. Clin. Oncol.13, 674–690 (2016). - PMC - PubMed

Publication types

MeSH terms

Substances