. 2024 Nov 26;15(1):10248.
doi: 10.1038/s41467-024-54474-w.

Multicentennial cycles in continental demography synchronous with solar activity and climate stability

Affiliations

Multicentennial cycles in continental demography synchronous with solar activity and climate stability

Kai W Wirtz et al. Nat Commun. .

Abstract

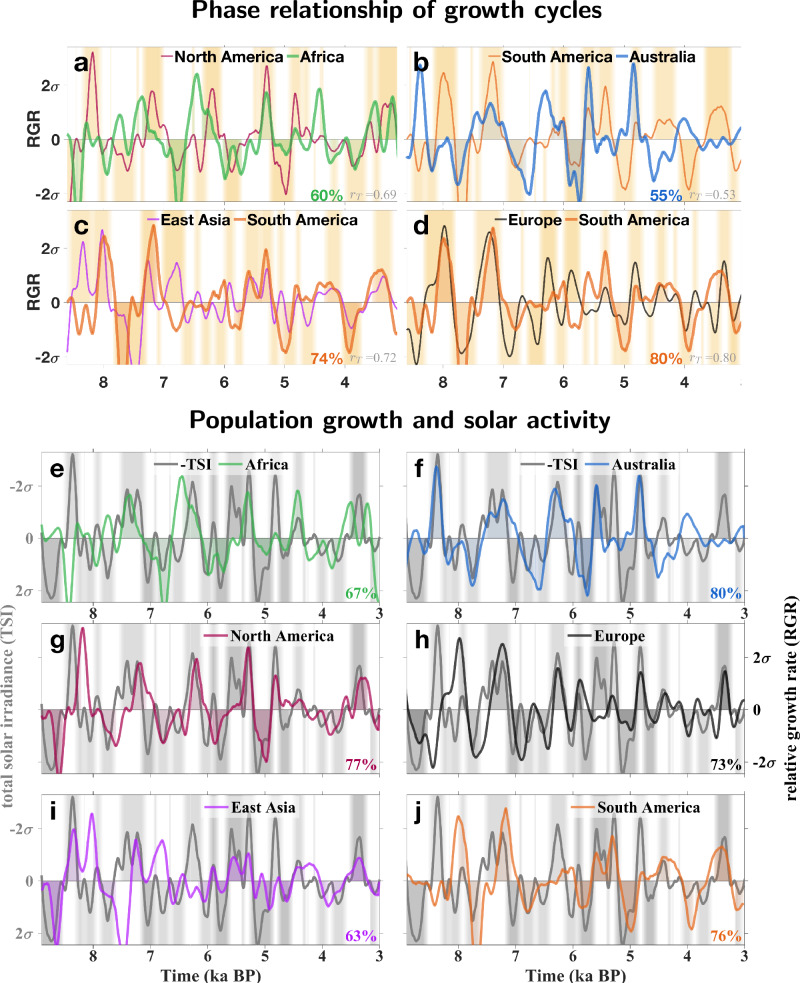
Human population dynamics and their drivers are not well understood, especially over the long term and on large scales. Here, we estimate demographic growth trajectories from 9 to 3 ka BP across the entire globe by employing summed probability distributions of radiocarbon dates. Our reconstruction reveals multicentennial growth cycles on all six inhabited continents, which exhibited matching dominant frequencies and phase relations. These growth oscillations were often also synchronised with multicentennial variations in solar activity. The growth cycle for Europe, reconstructed based on >91,000 radiocarbon dates, was backed by archaeology-derived settlement data and showed only a weak correlation with mean climate states, but a strong correlation with the stability of these states. We therefore suggest a link between multicentennial variations in solar activity and climate stability. This stability provided more favourable conditions for human subsistence success, and seems to have induced synchrony between regional growth cycles worldwide.


Conflict of interest statement

Competing interests: The authors declare no competing interests.

Figures

Fig. 1
Fig. 1. Global partitioning of 14C-dates into continental boxes.
The sometimes smaller extension of the boxes compared to the geographical boundaries of a continent reflect wide gaps in 14C-dated sites such as in South Asia. For Europe and western Anatolia, the focal study area, 15,089 archeological sites with 91,173 dates are shown as small brown circles. Subregions with independent reports of occupation density are approximated by green quadrangles (Tab. S4). Numbers indicate the locations of the 98 paleoclimate proxy sites (Tab. S2), and the yellow box the distribution of Northern Irish bogs used for the annual tree-ring reconstruction. Capital letters `NSWE' indicate the four cardinal directions.
Fig. 2
Fig. 2. Fluctuations in relative growth rate (RGR, change in Summed Probability Distribution, SPD) in all populated continents.
a–d Phase relationships between continental population cycles. Phases of either positive or negative RGR of the first continent are shaded. Percentage shows relative phase overlaps (see Methods). dj Phase relationships between continental RGR with negative total solar irradiance (TSI, with shading for positive and negative phases, resp.). All time-series in (aj) were normalized (division by standard deviation σ), smoothed and detrended.
Fig. 3
Fig. 3. Spectral similarity between growth fluctuations and potential forcings.
Fourier power spectrum of European relative growth rate (RGR, black or grey line) compared to (a) RGR of South and North America, (b) RGR of East Asia, Africa, and Australia, (c) proxies for solar activity: sunspot number and total solar irradiance (TSI), and the artificial RGR of a linear 14C distribution (calibration effect), (d) climate stability index for Europe based on Principal Components (PCs) of paleoproxy time-series and homogeneity in Northern Irish tree growth (reversed standard deviation of tree ring width in bogs) (e) boom minus bust density based on independent occupation reconstructions and the full logit model (‘3V’), (f) first and second PC of 98 paleoclimate proxies. Dark grey shading describes dominant periods of European and non-European RGR, light grey shading additional modes apparent in all climate forcings and in non-European RGRs.
Fig. 4
Fig. 4
Left: Conceptual model of human paleodemography. Subsistence success/failure and (partially dependent) mortality determine the relative growth rate (RGR) of human populations. Subsistence, in turn, is influenced by climate stability and the latter probably also by solar activity. During a boom, climate stability favors subsistence success enabling positive and high RGR (orange states). During a bust (blue colors), variations in climatic conditions induce subsistence failures, which in turn, enhance mortality through, e.g., malnutrition. Mortality also increases under elevated population density as a delayed consequence of a boom. Our logit model uses three configurations of input variables: ‘1V’ describes an endogenous control by past population growth and resulting low or high population density. The ‘2V’ variant reflects exogenous control incorporating solar activity and climate stability. The combination of the exogenous the endogenous configurations makes the ‘3V’ variant. Right: Idealized growth cycles. Human RGR (black line) alternating between boom (orange shading) and bust phases (light blue) with corresponding population density (brown line).
Fig. 5
Fig. 5. Relative growth rate (RGR, change in SPD) in Europe compared with possible drivers, and independent evidence.
The compared time-series were detrended and normalized (division by standard deviation σ). Boom and bust periods are shaded to ease the visual check of relative phase overlaps with the respective time-series (colored numbers, see Methods). Grey numbers indicate the trim correlation rT. Boom periods are labelled by archaeological phases as listed in Tab. S3. a Climate stability (reversed absolute change in PCs). b Probability of a boom minus the one of a bust derived from a logit model based on the three variables (3V) climate stability, total solar irradiance (TSI, Fig. S3a) from, and time-lagged growth rate (Fig. S3b). c Normalized number of (growth) booms minus the bust number derived from independent archaeological population proxies, mostly occupation density.
Fig. 6
Fig. 6. Population growth and environmental stability in Ireland.
Northern Ireland relative growth rate (RGR) compared to the negative anomaly of (spatial) standard deviation of tree ring width (‘homogeneity’) in Irish bogs as a local proxy for environmental homogeneity and stability.

References

    1. Ricklefs, R. E.The Economy of Nature (Macmillan, 2008).
    1. Dong, J., Li, W., Cao, Y. & Fang, J. How does technology and population progress relate? An empirical study of the last 10,000 years. Technol. Forecast. Soc. Change103, 57–70 (2016).
    1. Shennan, S. et al. Regional population collapse followed initial agriculture booms in mid-Holocene Europe. Nat. Commun.4, 2486 (2013). - PMC - PubMed
    1. Riris, P. & Arroyo-Kalin, M. Widespread population decline in South America correlates with mid-Holocene climate change. Sci. Rep.9, 1–10 (2019). - PMC - PubMed
    1. Palmisano, A., Lawrence, D., de Gruchy, M. W., Bevan, A. & Shennan, S. Holocene regional population dynamics and climatic trends in the Near East: A first comparison using archaeo-demographic proxies. Quatern. Sci. Rev.252, 106739 (2021).

Publication types

LinkOut - more resources