. 2024 Nov 26;15(1):10250.
doi: 10.1038/s41467-024-54638-8.

Quantitative determination of the spatial distribution of components in single cells with CellDetail

Affiliations

Quantitative determination of the spatial distribution of components in single cells with CellDetail

Tanja Schuster et al. Nat Commun. .

Abstract

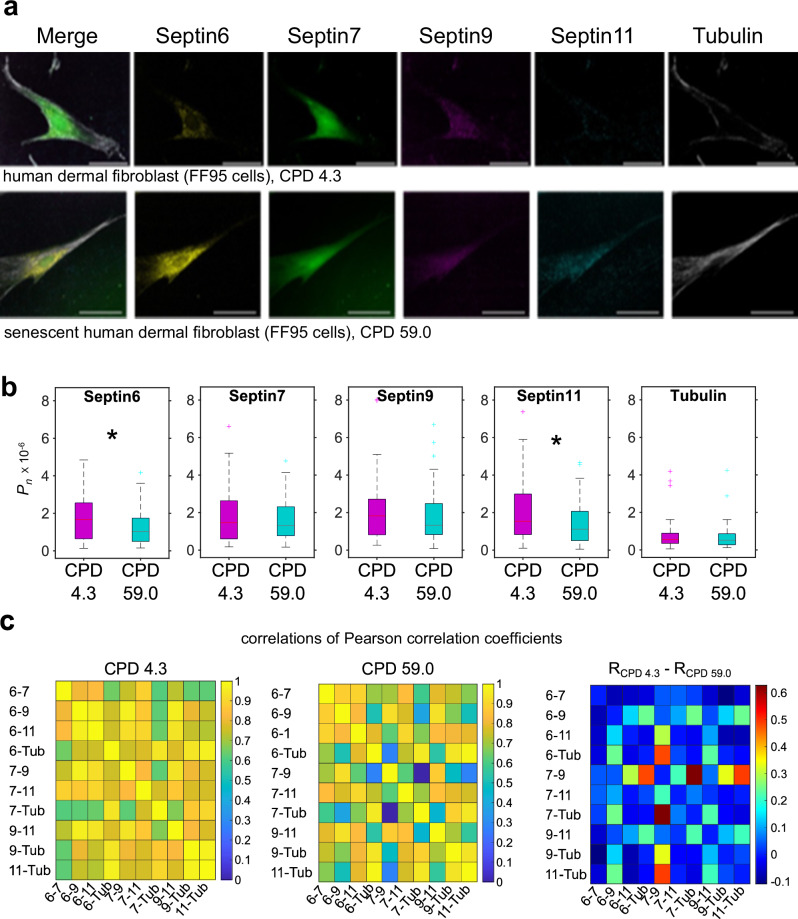
The distribution of biomolecules within cells changes upon aging and diseases. To quantitatively determine the spatial distribution of components inside cells, we built the user-friendly open-source 3D-cell-image analysis platform Cell Detection and Analysis of Intensity Lounge (CellDetail). The algorithm within CellDetail is based on the concept of the dipole moment. CellDetail provides quantitative values for the distribution of the polarity proteins Cdc42 and Tubulin in young and aged hematopoietic stem cells (HSCs). Septin proteins form networks within cells that are critical for cell compartmentalization. We uncover a reduced level of organization of the Septin network within aged HSCs and within senescent human fibroblasts. Changes in the Septin network structure might therefore be a common feature of aging. The level of organization of the network of Septin proteins in aged HSCs can be restored to a youthful level by pharmacological attenuation of the activity of the small RhoGTPase Cdc42.


Conflict of interest statement

Competing interests: The authors declare no competing interests.

Figures

Fig. 1
Fig. 1. Spatial distribution, algorithm and CellDetail.
a The level of polarity of the distribution of a component in a cell can adopt multiple distinct states and can thus be regarded as a continuous variable. b HSC with a polar distribution of the protein Cdc42 (red) (left: schematic, right: confocal IF image and bright field (BF), scale bar = 5 µm). c Left top: Equation to calculate the dipole moment (polarity) of chemical molecules. Left low: H2O is a highly polar molecule, while CO2 is a highly apolar molecule. (δ = charges, R = charge centers, d = distance, green arrow, P = dipole moment). Right top: Equation to calculate the dipole moment of a component within a cell (q = charges, R = charge centers, d = distance, green arrow, P = dipole moment). Charge centers of the red component in the cell are shown as red (positive charge center) and blue (negative charge center) crosses. d Sequential steps for quantifying polarity via the value Pn as output parameter in 3D IF images. e Example calculation of Pn for the protein Cdc42 in HSC (here single 2D layer). Step1 shows the conversion of intensity values into charge values by subtracting the average cell intensity, step2 shows the charge-weighted barycenters. More detail on these steps can be found in Supplementary F Algorithm. (ii) Pn is calculated based on the (i) normalized charge (qn1) and the normalized distance (Rn1) between the charge centers. f Output parameters of CellDetail: (i) polarity quantification, (ii) amount of the biomolecule, (iii) spatial volume of biomolecule, (iv) vectors between middle of cell and positive/negative charge-weighted centers, (v) grade of constriction of biomolecule charge centers, (vi) Pearson correlation analyses (RPearson) for inter-biomolecule behavior analyses. g Examples of z-stacks (3D) of HSCs visually apolar and polar for the distribution of the protein Cdc42 in HSCs (out of 14 apolar and 23 polar used in (h)). h Histogram of Pn values for the protein Cdc42 for 14 HSCs visually apolar for Cdc42 and 23 HSCs visually polar for Cdc42. Source data are provided as a Source Data file.
Fig. 2
Fig. 2. Polarity of Cdc42 and Tubulin in HSCs.
a Left: Confocal IF images (example from z-stacks) of Cdc42, Tubulin and DAPI (scale bar 5 µm). Right: Absolute value of Pn, with median as central mark, edges indicating 25th and 75th percentiles, whiskers extending to most extreme data points not considered outliers, outliers individually plotted. Median Cdc42: Pn,y = 1.0e-6, Pn,o = 0.7e-6, p = 2.3e-24, common language effect size (CLES) DCdc42 = 0.25, median Tubulin: Pn,y = 1.1e-6, Pn,o = 1.0e-6, p = 0.8, CLES DTubulin = 0.49, ny = 217, no = 372 b Left: Widefield IF images (example from z-stacks) of Cdc42, Tubulin and DAPI, scale bar 5 µm. Right: Absolute value of Pn, with median as central mark, edges indicating 25th and 75th percentiles, whiskers extending to most extreme data points not considered outliers, outliers individually plotted. Median Cdc42: Pn,y = 0.89e-6, Pn,o = 0.68e-6, p = 1e-12, CLES DCdc42 = 0.40, median Tubulin: Pn,y = 0.60e-6, Pn,o = 0.55e-6, p = 0.009, CLES DTubulin = 0.46, ny = 630, no = 1370. c Z-layers of individual cells (3D) and their Pn values of Cdc42 and Tubulin. d Percentage of cells over their Pn for young, old, and old HSCs treated with CASIN (nyoung = 92, nold = 98, noldCASIN = 96, median Pn,young = 0.81e-6, Pn,old = 0.64e-6, Pn,oldCASIN = 0.84e-6, pyoung,old = 0.0032, pyoung,oldCASIN = 8.0e-4, pyoung,oldCASIN = 0.9, CLES Dyoung,old = 0.38, Dold,old treated = 0.36) (ad) all two-sided Wilcoxon-Ranksum test. e Cumulative percentage of HSCs in dependence on Pn value distribution (data from (d)). f Scheme for determination of dnucleus via |MR| (green arrow) and the maximal diameter dmax (orange arrow). g Pearson correlation coefficients RPearson of the Pn of DAPI, Cdc42 and Tubulin vs. dnucleus, with p < 0.05 for all correlations shown (two-sided). pold,dnucleus,Cdc42 = 2.8e-129, pold,dnucleus,Tubulin = 0.0024, pold,dnucleus,DAPI = 7.3e-157; pyoung,dnucleus,Cdc42 = 1.0e-30, pyoung,dnucleus,Tubulin = 0.001, pyoung,dnucleus,DAPI = 2.0e-46. Source data are provided as a Source Data file.
Fig. 3
Fig. 3. The organization of the Septin network in HSCs changes upon aging.
a IF images (example from z-stacks) of a young or old HSC (scale bar 5 µm) of Septins 1,2,6,7,9,11. b Absolute value of Pn, with median as central mark, edges indicating 25th and 75th percentiles, whiskers extending to most extreme data points not considered outliers, outliers individually plotted. Common language effect size (CLES) DSept2 = 0.35, DSept6 = 0.36, DSept7 = 0.28, DSept9 = 0.30, DSept11 = 0.34; pSept1 = 0.27, pSept2 = 2.0e-12, pSept6 = 5.6e-11, pSept7 = 1.5e-24, pSept9 = 7.1e-22, pSept11 = 1.2e-13, ny = 330 and no = 440. c Distance d |between positive charge centers (box plots, median as central mark, edges indicating 25th and 75th percentiles, whiskers extending to most extreme data points not considered outliers, outliers individually plotted), ny = 330 and no = 440. CLES DSept6-Sept7 = 0.45, DSept7-Sept9 = 0.41, DSept7-Sept11 = 0.45. pSept6-Sept7 = 0.03, pSept7-Sept9 = 2.9e-5, pSept7-Sept11 = 0.03. d Graphical representations of examples of the distance d between charge centers. e Angle α between different positive charge centers of distinct Septins in young or old HSCs, median, ny = 330 and no = 440. CLES DSept6-Sept7 = 0.38, DSept6-Sept11 = 0.40, pSept6-Sept7 = 6.3e-9, pSept6-Sept11 = 1.4e-6. f Graphical representations of examples of the angle α between charge centers. g Pearson correlation coefficient values (RPearson,image, output parameter of CellDetail) of the intensity channels for distinct combinations of Septins (box plots, median as central mark, edges indicating 25th and 75th percentiles, whiskers extending to most extreme data points not considered outliers, outliers individually plotted), pSept2-Sept6 = 2.2e-4, pSept2-Sept9 = 0.02, pSept2-Sept11 = 0.02, pSept6-Sept9 = 0.01, pSept7-Sept9 = 7.2e-6, pSept9-Sept11 = 0.006, ny = 330 and no = 440. CLES for distributions with significant different medians are: D2-6 = 0.42, D2-9 = 0.45, D2-11 = 0.45, D6-9 = 0.45, D7-9 = 0.41, D9-11 = 0.44. b, c, e, g two-sided Wilcoxon Ranksum test. Source data are provided as a Source Data file.
Fig. 4
Fig. 4. The level of organization of the network of Septin proteins in aged HSCs can be restored to a youthful level by pharmacological attenuation of the activity of the small RhoGTPase Cdc42.
a IF images (examples) of one z-stack plane of old or old HSC treated with CASIN (scale bar 5 µm) of Cdc42 and Septins 6,7,9. b Pn of Cdc42 and Septins 6,7, 9 (box plots, with median as central mark, bottom and top edges of box indicating 25th and 75th percentiles and whiskers extending to most extreme data points not considered outliers, and outliers individually plotted). nold = 57, nold,CASIN = 60 HSCs the same old mice. Median, two-sided Wilcoxon-Ranksum test, pCdc42 = 0.01, pSept6 = 0.0036, pSept7 = 1.5e-4, pSept9 = 3.7e-4. Common language effect size (CLES): DCdc42 = 0.36, DSeptin6 = 0.34, DSeptin7 = 0.30, DSeptin9 = 0.31. c RSpearman of Pn of Cdc42 and Pn of Septins of old and old+CASIN HSCs. nold = 57, nold,CASIN = 60. pold,Cdc42Sept6 = 0.22, pold,Cdc42Sept7 = 0.19, pold,Cdc42Sept9 = 0.01, poldCASIN,Cdc42Sept6 = 0.048, poldCASIN,Cdc42Sept7 = 0.03, poldCASIN,Cdc42Sept9 = 0.03. Source data are provided as a Source Data file.
Fig. 5
Fig. 5. Polarity of Septins and the organization of the Septin network in human dermal fibroblasts is affected by senescence/aging.
a IF images (examples) of one z-stack plane of young and senescent human FF95 dermal fibroblasts for Septins 6,7,11 and Tubulin (scale bar 50 µm). b Absolute value of Pn, with median as central mark, edges indicating 25th and 75th percentiles, whiskers extending to most extreme data points not considered outliers, outliers individually plotted. Common language effect size (CLES): DSept6 = 0.39, DSept11 = 0.39, two-sided Wilcoxon-Ranksum test (pSept6 = 0.04, pSept7 = 0.96, pSept9 = 0.4, pSept11 = 0.05, pTubulin = 0.6), nCPD4.3 = 50, nCPD59.0 = 68. c Pearson correlation coefficients (RPearson) of paired-channel-based Pearson correlation coefficients (RPearson, output parameter of CellDetail) for distinct combinations of Septins and Tubulin of young and senescent human FF95 dermal fibroblasts (nCPD4.3 = 50, nCPD59.0 = 68) and right, their difference in correlation coefficients. Except for 7-Tub with 7-9 in CPD 59.0 FF95 cells, all correlations were significant (p < 0.05, two-sided; provided within Source Data file). Source data are provided as a Source Data file.

References

    1. Chang, J. T. et al. Asymmetric t lymphocyte division in the initiation of adaptive immune responses. Science315, 1687–1691 (2007). - PubMed
    1. Florian, M. C. et al. Cdc42 activity regulates hematopoietic stem cell aging and rejuvenation. Cell Stem Cell10, 520–530 (2012). - PMC - PubMed
    1. Horiguchi, K., Hanada, T., Fukui, Y. & Chishti, A. H. Transport of pip3 by gakin, a kinesin-3 family protein, regulates neuronal cell polarity. J. Cell Biol.174, 425–436 (2006). - PMC - PubMed
    1. Kaeberlein, M. Lessons on longevity from budding yeast. Nature464, 513–519 (2010). - PMC - PubMed
    1. Lee, M. E., Rusin, S. F., Jenkins, N., Kettenbach, A. N. & Moseley, J. B. Mechanisms connecting the conserved protein kinases ssp1, kin1, and pom1 in fission yeast cell polarity and division. Curr. Biol.28, 84–92.e4 (2018). - PMC - PubMed

Publication types