. 2024 Nov 26;14(1):29393.
doi: 10.1038/s41598-024-76415-9.

miR-1, miR-133a, miR-29b and skeletal muscle fibrosis in chronic limb-threatening ischaemia

Affiliations

miR-1, miR-133a, miR-29b and skeletal muscle fibrosis in chronic limb-threatening ischaemia

Alan J Keane et al. Sci Rep. .

Abstract

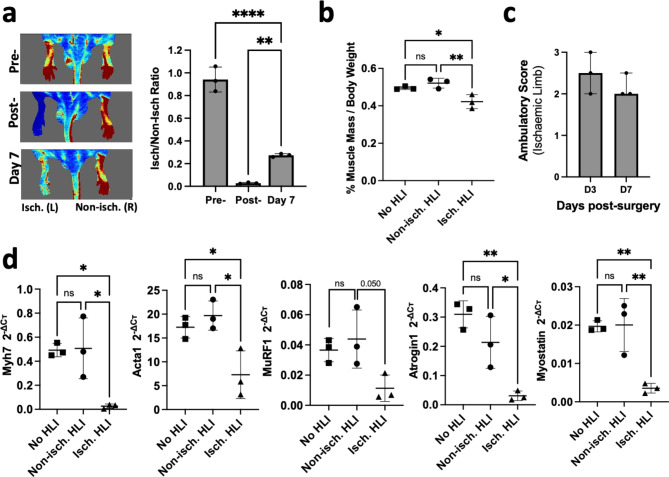
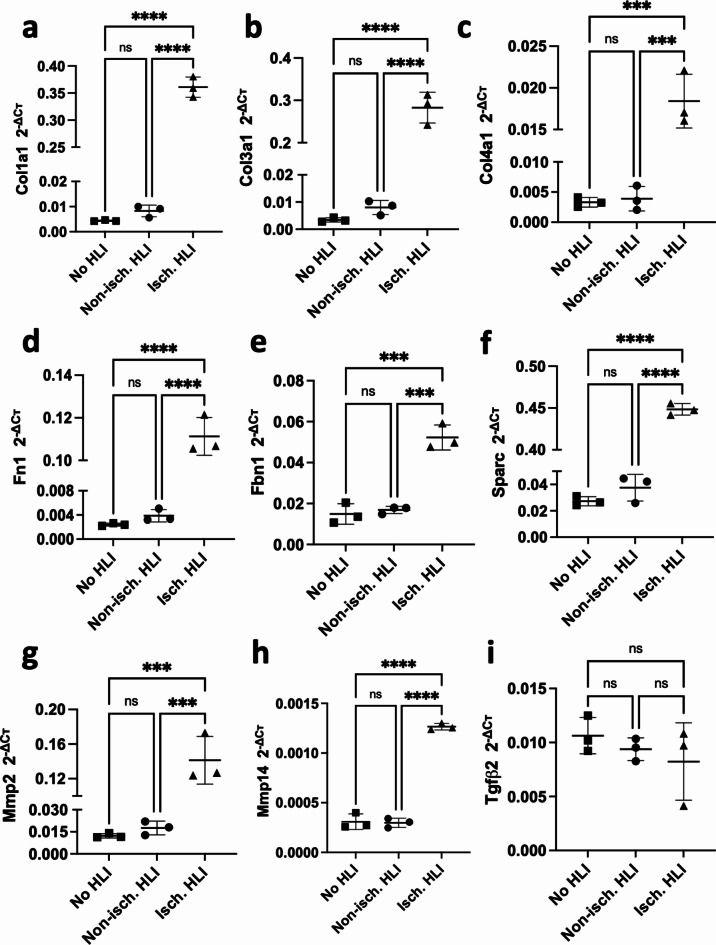
Chronic limb-threatening ischaemia (CLTI), the most severe manifestation of peripheral arterial disease (PAD), is associated with a poor prognosis and high amputation rates. Despite novel therapeutic approaches being investigated, no significant clinical benefits have been observed yet. Understanding the molecular pathways of skeletal muscle dysfunction in CLTI is crucial for designing successful treatments. This study aimed to identify miRNAs dysregulated in muscle biopsies from PAD cohorts. Using MIcroRNA ENrichment TURned NETwork (MIENTURNET) on a publicly accessible RNA-sequencing dataset of PAD cohorts, we identified a list of miRNAs that were over-represented among the upregulated differentially expressed genes (DEGs) in CLTI. Next, we validated the altered expression of these miRNAs and their targets in mice with hindlimb ischaemia (HLI). Our results showed a significant downregulation of miR-1, miR-133a, and miR-29b levels in the ischaemic limbs versus the contralateral non-ischaemic limb. A miRNA target protein-protein interaction network identified extracellular matrix components, including collagen-1a1, -3a1, and -4a1, fibronectin-1, fibrin-1, matrix metalloproteinase-2 and -14, and Sparc, which were upregulated in the ischaemic muscle of mice. This is the first study to identify miR-1, miR-133a, and miR-29b as potential contributors to fibrosis and vascular pathology in CLTI muscle, which supports their potential as novel therapeutic agents for this condition.

Keywords: Chronic limb-threatening ischaemia; Fibrosis; MicroRNAs; Muscle regeneration.


Conflict of interest statement

Declarations. Competing interests: TOB is a founder, director, and equity holder in Orbsen Therapeutics Ltd. The other authors do not have competing interests to declare. Ethical approval: All animal experiments were carried out in compliance with the Directive 2010/63/EU. Ethical approval was granted by the Animal Care Research Ethics Committee (ACREC) at the University of Galway (Ireland) and appropriate individual and project authorizations were granted by the Health Products Regulatory Authority in Ireland (AE19125 /P076).

Figures

Fig. 1
Fig. 1
Significantly overrepresented miRNAs amongst UpDEGs in CLTI, IC and non-PAD muscle. A network representation of the enriched MTIs in upregulated DEGs in skeletal muscle from patients with CLTI and IC. The MIENTURNET tool was used to create an MTI network of the significantly enriched MTIs in CLTI vs. non-PAD muscle (a) and CLTI vs. IC muscle (b) using the miRTarBase database for experimentally validated MTIs. No MTI network was created for IC vs. non-PAD muscle as there were no significantly enriched MTIs when comparing these two groups. The MTI network was visualised using Cytoscape. miRNAs are represented by grey nodes and mRNA targets are represented by yellow nodes. Edges represent validated MTIs. For more information on miRNA targets please refer to Supplementary Information S1.
Fig. 2
Fig. 2
Severe calf muscle pathology 7 days post-HLI. (a) Blood flow perfusion of mice foot using Laser Doppler Imaging. Colour-coded images displayed poor perfusion as dark blue, and the highest perfusion level was displayed as red. Data are mean ± SD. **p < 0.01, *p < 0.05 (one-way ANOVA, Tukey’s multiple comparisons test). (b) Percentage of calf muscle wet weight per body weight. Data are mean ± SD. **p < 0.01, *p < 0.05 (one-way ANOVA, Tukey’s multiple comparisons test). (c) Assessment of limb functionality using the ambulatory score (3 = dragging the foot; 2 = no dragging the foot but no plantar flexion; 1 = plantar flexion but no flexion of toes; 0 = flexion of toes to resist traction on the tail similar to the non-operated foot). (d) Expression levels of Myh7, Acta1, MuRF1, Atrogin1 and Myostatin assessed by RT-qPCR. Cт values were normalised to the geometric mean of Rpl13a and Gapdh using the 2−ΔCт method. Data are presented as mean ± SD. *p < 0.05, **p < 0.01 (one-way ANOVA, Tukey’s multiple comparison test).
Fig. 3
Fig. 3
Assessment of ischaemia-induced skeletal muscle damage. (a) Representative images of skeletal muscle sections stained with H&E, Mallory’s Trichrome stain and muscle fibre morphology by WGA/DAPI staining. Scale bar 10X = 250 μm; 20X = 50 μm (Brightfield images), 10X = 275 μm (Fluorescent image), WGA (green), DAPI (blue). (b) Semiquantitative histopathological assessment of ischaemic damage: bi) individual scores for each histopathological parameter assessed; bii) cumulative ischaemia severity score (cISS). Data are median ± IQR. (c) Expression levels of F4/80, CD206 and TNFα assessed by RT-qPCR. Cт values were normalised to the geometric mean of Rpl13a and Gapdh using the 2−ΔCт method. Data are mean ± SD. *p < 0.05, **p < 0.01 (one-way ANOVA, Tukey’s multiple comparison test).
Fig. 4
Fig. 4
Validation of over-represented miRNAs in CLTI skeletal muscle using HLI mouse model. The expression levels of (a) miR-1-3p, (b) miR-133a-3p, (c) miR-29b-3p, (d) miR-124-3p and (e) miR-335-5p were assessed in the gastrocnemius muscle of no HLI (control) mice and of HLI mice via RT-qPCR. miRNA Cт values were normalised to miR-27b using the 2−ΔCт method. Data are presented as mean formula imageSD. * p < 0.05, ** p < 0.01, *** p < 0.001. One-way ANOVA and Tukey’s multiple comparison test.
Fig. 5
Fig. 5
Subnetwork analysis of miR-1, miR-133a and miR-29b targets. (a) Subnetwork of the MTI network in Fig. 1 of miR-1, miR-133a, and miR-29b and their targets which are also upregulated in CLTI was created using Cytoscape. miRNAs are represented by grey nodes and mRNA targets are represented by yellow nodes; edges represent validated MTI from the miRTarBase database. N = total miRNA targets. (b) Venn diagram representation of miR-1, miR-133a and miR-29b shared targets. (c) The hub nodes of the PPI network in Fig S1 were identified in Cytoscape using CytoHubba and the MCC topological analysis method. The top 20 hub nodes were used to create a subnetwork. Node colour indicates hub node essentiality, red indicates greater hub node rank and yellow indicates lesser hub node rank. (d) Venn diagram representation of pro-fibrotic transcripts selected from the top 20 hub nodes which are targeted by miR-1, miR-133a and/or miR-29b.
Fig. 6
Fig. 6
Enrichment map of miR-1, miR-133a, and miR-29b targets upregulated in CLTI. Functional enrichment analysis was performed on the targets of miR-1, miR-133a, and miR-29b that are upregulated in CLTI gastrocnemius using g: Profiler. EnrichmentMapping was performed using the EnrichmentMap plugin in Cytoscape. Cluster labels created using the AutoAnnotate plugin were manually edited. Nodes represent enriched pathways identified using g: Profiler. Edges represent, and are weighted by, pathway gene set overlap. Node colour is mapped to pathway enrichment significance (orange = lower Q value and white = higher Q value). Node size is mapped to gene set size.
Fig. 7
Fig. 7
Expression of hub nodes of the miR-1, miR-133a, and miR-29b target PPI network in skeletal muscle ischaemia. The expression levels of (a) Col1a1, (b) Col3a1, (c) Col4a1, (d) Fn1, (e) Fbn1, (f) Sparc, (g) Mmp2, (h) Mmp14, and (i) Tgfβ2 were assessed in the gastrocnemius muscle of no-HLI (control) mice and of HLI mice via RT-qPCR. miRNA Cт values were normalised the geometric mean of Rpl13a and Gapdh expression using the 2−ΔCт method. Data are presented as mean formula imageSD. * p < 0.05, ** p < 0.01, *** p < 0.001. One-way ANOVA and Tukey’s multiple comparison test.

References

    1. Norgren, L. et al. Inter-society Consensus for the management of peripheral arterial disease (TASC II). in 33 Suppl 1 S1–75 (2007). - PubMed
    1. Garg, P. K. et al. Lower extremity nerve function, calf skeletal muscle characteristics, and functional performance in peripheral arterial disease. J. Am. Geriatr. Soc. 59, 1855–1863 (2011). - PMC - PubMed
    1. McDermott, M. M. Lower extremity manifestations of peripheral artery disease: the pathophysiologic and functional implications of leg ischemia. Circ. Res. 116, 1540–1550 (2015). - PMC - PubMed
    1. McDermott, M. M. et al. Calf muscle characteristics, strength measures, and mortality in peripheral arterial disease. J. Am. Coll. Cardiol. 59, 1159–1167 (2012). - PMC - PubMed
    1. McDermott, M. M. et al. Skeletal muscle pathology in peripheral artery disease. Arter Thromb. Vasc Biol. 40, 2577–2585 (2020). - PMC - PubMed

MeSH terms

LinkOut - more resources