. 2024 Nov 26;14(1):29307.
doi: 10.1038/s41598-024-80930-0.

Gucy1α1 specifically marks kidney, heart, lung and liver fibroblasts

Affiliations

Gucy1α1 specifically marks kidney, heart, lung and liver fibroblasts

Valeria Rudman-Melnick et al. Sci Rep. .

Abstract

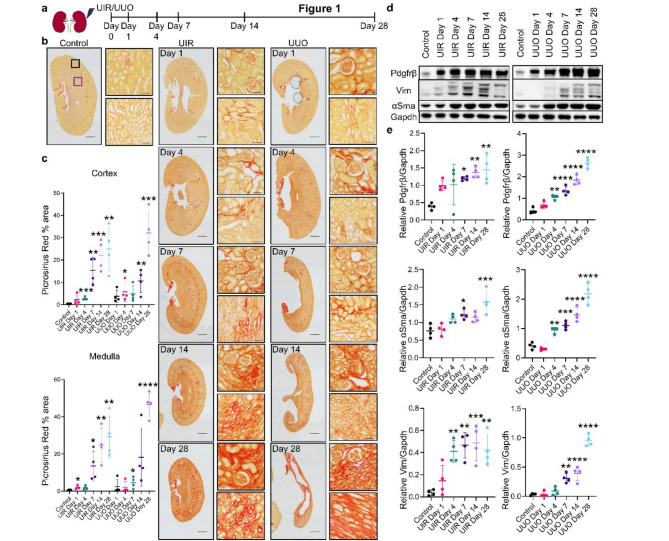
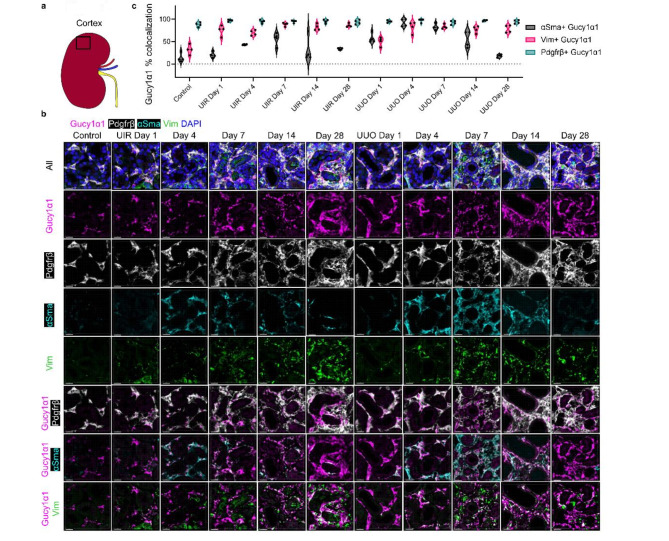
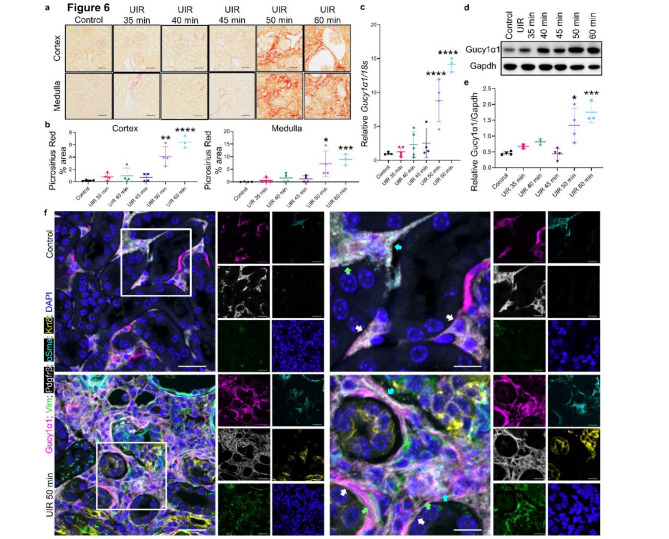
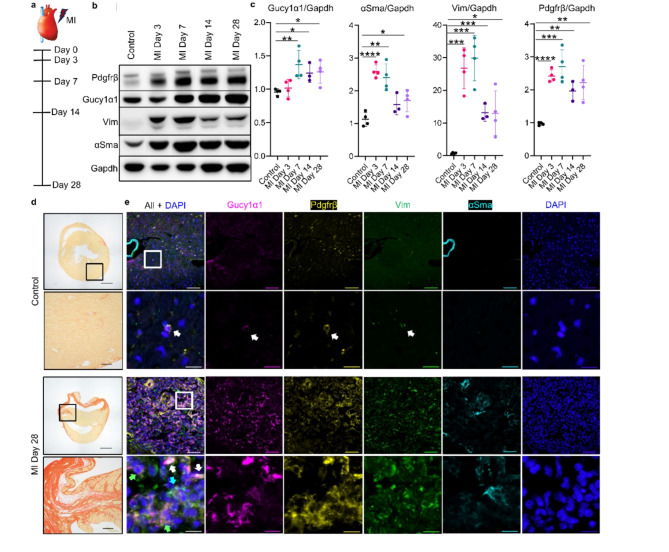
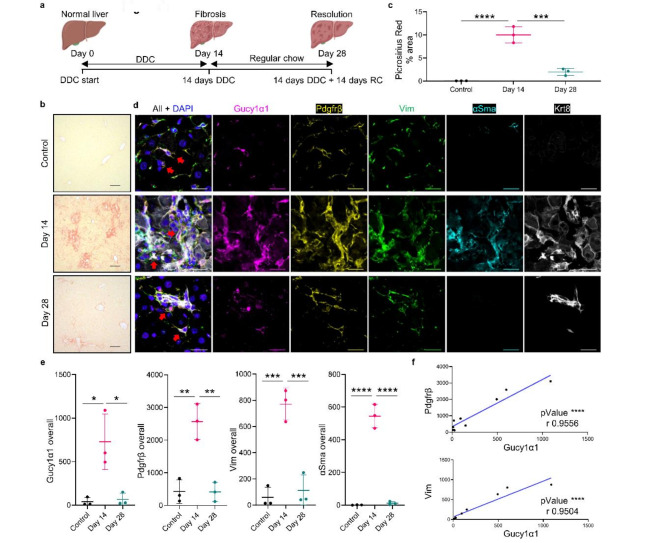
Fibrosis is a common outcome of numerous pathologies, including chronic kidney disease (CKD), a progressive renal function deterioration. Current approaches to target activated fibroblasts, key effector contributors to fibrotic tissue remodeling, lack specificity. Here, we report Gucy1α1 as a specific kidney fibroblast marker. Gucy1α1 levels significantly increased over the course of two clinically relevant murine CKD models and directly correlated with established fibrosis markers. Immunofluorescent (IF) imaging showed that Gucy1α1 comprehensively labelled cortical and medullary quiescent and activated fibroblasts in the control kidney and throughout injury progression, respectively. Unlike traditionally used markers platelet derived growth factor receptor beta (Pdgfrβ) and vimentin (Vim), Gucy1α1 did not overlap with off-target populations such as podocytes. Notably, Gucy1α1 labelled kidney fibroblasts in both male and female mice. Furthermore, we observed elevated GUCY1α1 expression in the human fibrotic kidney and lung. Studies in the murine models of cardiac and liver fibrosis revealed Gucy1α1 elevation in activated Pdgfrβ-, Vim- and alpha smooth muscle actin (αSma)-expressing fibroblasts paralleling injury progression and resolution. Overall, we demonstrate Gucy1α1 as an exclusive fibroblast marker in both sexes. Due to its multiorgan translational potential, GUCY1α1 might provide a novel promising strategy to specifically target and mechanistically examine fibroblasts.

Keywords: CKD; Kidney fibrosis; Multiorgan fibroblast marker.


Conflict of interest statement

Declarations. Competing interests: The authors declare no competing interests.

Figures

Fig. 1
Fig. 1
UIR and UUO induced murine CKD models exhibited progressive kidney fibrotic remodeling. (A) Schematic of the murine CKD progression model experimental timeline. (B and C) Picrosirius Red staining showing ECM accumulation over the course of UIR and UUO. (B) Representative whole kidney images (original magnification, ×4, 1.48 μm/px zoom, scale 1000 μm) and ×20 0.30 μm/px zoom (cortical – upper images, exemplifying location highlighted with black frames on the control kidney image, medullary – lower images, purple frames, scale 50 μm). (C) Quantification of total staining in kidney cortex and medulla, n = 4 per group, unpaired 2-tailed t-test, P *≤0.05, **≤0.01, ***≤0.001, ****≤0.0001 compared to the control. (D and E) Western blotting showing gradual fibrosis markers upregulation over the course of UIR and UUO. (D) Representative Pdgfrβ, αSma, Vim, Gapdh bands. (E) Western blotting quantification, Pdgfrβ, αSma, Vim signal normalized to Gapdh, n = 4 per group, ordinary one-way ANOVA, P *≤0.05, **≤0.01, ***≤0.001, ****≤0.0001 compared to the control. Data in scatter plots is presented as mean ± SD.
Fig. 2
Fig. 2
Gucy1α1 levels increase as kidney injury progresses and correlate with key fibrosis markers. (A) qPCR showing Gucy1α1 expression changes over the course of UIR and UUO. Relative expression normalized to 18s, shown as fold change, n = 4 per group, ordinary one-way ANOVA, P *≤0.05, **≤0.01, ***≤0.001, ****≤0.0001 compared to the control. (B-D) Western blotting demonstrating progressive Gucy1α1 elevation accompanying fibrosis progression in both models, images (B and C) and quantification (D). Gucy1α1 signal normalized to Gapdh, n = 4 per group, ordinary one-way ANOVA, P **≤0.01, ***≤0.001, ****≤0.0001 compared to the control. (E and F) Correlation analysis between normalized Pdgfrβ, αSma, Vim levels and Gucy1α1 in the control and UIR (E) and control and UUO (F) models at all experimental timepoints. Pearson r correlation analysis, n = 24 per marker (control, Day 1, Day 4, Day 7, Day 14, Day 28, n = 4 per each group), r values and P as **≤0.01, ***≤0.001, ****≤0.0001 for each pair are shown on the graphs presenting simple linear regression of correlation between Pdgfrβ, αSma, Vim vs. Gucy1α1. Data in scatter plots is presented as mean ± SD.
Fig. 3
Fig. 3
Gucy1α1 co-labels Pdgfrβ-, αSma- and Vim-positive fractions of the baseline and activated kidney fibroblasts in the cortical areas. (A) Schematic of the kidney anatomy with respect to cortical area (highlighted with a black frame). (B) Representative IF images of the control, UIR/UUO Day 1, 4, 7, 14 and 28 kidneys. Note remarkable degree of colocalization between Gucy1α1 (magenta) and Pdgfrβ (white). Also note that portions of Gucy1α1 expressing areas are positive for αSma (cyan) and Vim (green). DAPI, blue. The upper panels show all combined signals, the middle panels show individual channels, and three bottom panels demonstrate Gucy1α1 along with Pdgfrβ, αSma or Vim, respectively. Original magnification, × 60, maximal intensity projection from a Z-stack, 0.09 μm/px Nyquist zoom, scale 15 μm. (C) Violin plot showing quantitative IF analysis of cortical patterns of kidney fibrosis markers expression. Note near-total overlap between cortical Gucy1α1- and Pdgfrβ-positive areas (average percentage of Pdgfrβ co-expression in Gucy1α1-positive areas for control: 88%; UIR Day 1: 97%, Day 4: 95%, Day 7: 95%, Day 14: 95.5%, Day 28: 93.5%; UUO Day 1: 95%, Day 4: 97%, Day 7: 92.5%, Day 14: 97%, Day 28: 94.25%). On the contrary, only 13.8% of control cortical Gucy1α1-positive interstitial areas exhibited αSma positivity. This number rose as both injuries progressed, peaked at UIR Day 7 (average 56%) and UUO Day 4 (average 92.25%) and then declined. Most cortical Gucy1α1-expressing areas retained Vim co-expression throughout both injuries. N = 4 animals per group. Only interstitial non-glomerular areas were included in the analysis.
Fig. 4
Fig. 4
Gucy1α1 co-labels Pdgfrβ-, αSma- and Vim-positive fractions of the baseline and activated kidney fibroblasts in the medullary areas. (A) Schematic of the kidney anatomy with respect to medullary area (highlighted with a black frame). (B) Representative IF images of the control, UIR/UUO Day 1, 4, 7, 14 and 28 kidneys, Gucy1α1 (magenta), Pdgfrβ (white), αSma (cyan), Vim (green), DAPI, blue. The upper panels show all combined signals, the middle panels show individual channels, and three bottom panels demonstrate Gucy1α1 along with Pdgfrβ, αSma or Vim, respectively. Original magnification, × 60, maximal intensity projection from a Z-stack, 0.09 μm/px Nyquist zoom, scale 15 μm. (C) Violin plot showing quantitative IF analysis of medullary patterns of kidney fibrosis markers expression. Note near-total overlap between Gucy1α1- and Pdgfrβ-positive areas in the control kidneys and at all stages of both injuries (average percentage of Pdgfrβ co-expression in Gucy1α1-positive areas for control: 92%; UIR Day 1: 97.75%, Day 4: 98.25%, Day 7: 97.75%, Day 14: 93%, Day 28: 91.75%; UUO Day 1: 97%, Day 4: 97.75%, Day 7: 93.25%, Day 14: 95.5%, Day 28: 95.25%). Also note that medullary Gucy1α1-expressing fibroblasts acquired αSma co-expression more abruptly and robustly than the cortical ones, and retained it at higher percentages (average double positivity for control: 16.5%; UIR Day 1: 85.75%, Day 4: 92%, Day 7: 85%, Day 14: 86.75%, Day 28: 69.25%; UUO Day 1: 76%, Day 4: 96.25%, Day 7: 87.5%, Day 14: 96.5%, Day 28: 88.25%). Similar to the cortex, most medullary Gucy1α1-positive areas exhibited Vim co-expression. N = 4 animals per group.
Fig. 5
Fig. 5
Gucy1α1 does not label glomerular populations compared to historically used kidney fibrosis markers. (A) Representative IF images showing Gucy1α1 (magenta), Pdgfrβ (yellow) and Vim (green), Nphs1 (white), DAPI, blue. Pdgfrβ and Vim are abundantly present inside the glomerulus, including colocalization with Nphs1-positive podocytes (shown with white arrows). Original magnification, × 60, maximal intensity projection from a Z-stack, 0.08 μm/px Nyquist zoom, scale 25 μm (B and C) Quantitative IF analysis of intraglomerular Gucy1α1, Pdgfrβ and Vim expression in the control and UIR/UUO treated kidneys. Gucy1α1, Pdgfrβ and Vim signals are normalized to Nphs1-expressing area volume and averaged from all the glomeruli captured in the imaging field, n = 4 animals per group. Gucy1α1 and Pdgfrβ (B) or Gucy1α1 and Vim (C) normalized averaged intraglomerular signals are compared using multiple unpaired t-test with FDR correction for multiple comparisons. P values are shown as P *≤0.05, **≤0.01, ***≤0.001, ****≤0.0001, n.s., not significant between each pair of markers at each timepoint. (B) q values for Gucy1α1 vs. Pdgfrβ comparisons: control: 0.001729; UIR Day 1: 0.001729, Day 4: 0.006212, Day 7: 0.017478, Day 14: 0.001729, Day 28: 0.000237; UUO Day 1: 0.037973, Day 4: 0.018007, Day 7: 0.004218, Day 14: 0.004218, Day 28: 0.021214. (C) q values for Gucy1α1 vs. Vim comparisons: control: 0.001093; UIR Day 1: 0.001279, Day 4: 0.000177, Day 7: 0.001093, Day 14: 0.000013, Day 28: 0.000005; UUO Day 1: 0.000059, Day 4: 0.000102, Day 7: 0.001838, Day 14: 0.000177, Day 28: 0.000327. Data in scatter plots is presented as mean ± SD.
Fig. 6
Fig. 6
Gucy1α1 marks kidney fibroblasts in the female model of murine CKD. (A and B) Picrosirius Red representative images and quantification showing the effects of prolonged UIR on the female kidney. (A) Original magnification, ×20, 0.30 μm/px zoom, scale 50 μm. (B) Quantification of total staining in kidney cortex and medulla, n = 3–5 per group, unpaired 2-tailed t-test, P *≤0.05, **≤0.01, ***≤0.001, ****≤0.0001 compared to the control. (C) qPCR showing Gucy1α1 expression changes in the female CKD model. Relative expression normalized to 18s, shown as fold change, n = 3–5 per group, ordinary one-way ANOVA, ****≤0.0001 compared to the control. (D and E) Western blotting revealing that 50 and 60 min UIR caused significant Gucy1α1 upregulation in the female CKD model. Representative bands (D) and quantification (E), Gucy1α1 signal normalized to Gapdh, n = 2–4 per group, ordinary one-way ANOVA, P *≤0.05, ***≤0.001 compared to the control. (F) IF images showing Gucy1α1 expression in the female normal and fibrotic kidneys. 50 min UIR caused remarkable stromal expansion, accompanied by fibrosis markers Gucy1α1 (magenta), Pdgfrβ (white), αSma (cyan) and Vim (green) elevation between Krt8 (yellow) positive injured epithelial tubules. Note colocalization between Gucy1α1 and Pdgfrβ (white arrows), αSma (cyan arrows) and Vim (green arrows) in both control and fibrotic conditions. DAPI, blue, original magnification, × 60, maximal intensity projection from a Z-stack, 0.14 μm/px Nyquist zoom, scale 25 μm (left side) and 0.06 μm/px Nyquist zoom, scale 10 μm (right side, highlighted with white frames). Data in scatter plots is presented as mean ± SD.
Fig. 7
Fig. 7
Gucy1α1 labels cardiac fibroblasts in the MI model of heart fibrosis. (A) Schematic of the MI progression model experimental timeline. (B and C) Western blotting showing Gucy1α1, Pdgfrβ, αSma and Vim expression changes over the course of MI. Representative bands (B) and quantification (C) of Gucy1α1, Pdgfrβ, αSma and Vim signal normalized to Gapdh. N = 3–4 per group, unpaired 2-tailed t-test, P *≤0.05, **≤0.01, ***≤0.001, ****≤0.0001 compared to the control. Note that all fibrosis markers peaked at Day 3–7 post-MI. (D) Picrosirius Red staining demonstrating mature scar formation in the myocardial wall at MI Day 28 compared to the control heart. Whole heart image, original magnification, ×4, 1.48 μm/px zoom, scale 1000 μm and ×20 0.30 μm/px zoom, scale 100 μm (highlighted with black frames). (E) IF revealing Gucy1α1 expression in the normal and fibrotic heart. Gucy1α1 (magenta), Pdgfrβ (yellow), αSma (cyan), Vim (green) and DAPI (blue). Original magnification, ×60; upper panels - maximal intensity projection from a Z-stack, 0.28 μm/px Nyquist resolution, scale 50 μm; lower panels − 0.05 μm/px Nyquist zoom, scale 10 μm (highlighted with white frames). Note that in the normal heart Gucy1α1 exhibits episodic expression in Pdgfrβ-positive fibroblasts (white arrow). MI caused robust Gucy1α1 elevation and colocalization with Pdgfrβ- (white arrows), αSma- (cyan arrow) and Vim-positive (green arrow) areas. Data in scatter plots is presented as mean ± SD.
Fig. 8
Fig. 8
Gucy1α1 expression trajectory parallels DDC induced liver fibrosis resolution. (A) Schematic of the biliary fibrosis model. DDC is administered for 14 days, then regular chow (RC) is given. (B and C) Picrosirius Red staining. (B) Representative images, original magnification, ×20, 0.30 μm/px zoom, scale 100 μm. (C) Quantitative Picrosirius Red staining analysis, n = 3 per group, ordinary one-way ANOVA, P ****≤0.0001 compared to the control. (D and E) IF demonstrating the expression of fibrosis markers in the liver over the course of DDC response. (D) Representative IF images demonstrate baseline Gucy1α1 (magenta) expression (red arrows) in the spindle-shaped Pdgfrβ- (yellow) and Vim-positive (green) liver fibroblasts. Baseline αSma (cyan) expression is very low. DDC administration results in dramatic Gucy1α1, Pdgfrβ, αSma and Vim upregulation and colocalization (areas of colocalization pointed with red arrows). 14 days after DDC withdrawal (Day 28) only traces of periductal (Krt8, white) and interstitial fibrosis remain (red arrows). DAPI, blue. Original magnification, ×60, maximal intensity projection from a Z-stack, 0.09 μm/px Nyquist resolution, scale 20 μm. (E) IF quantification, n = 3 per group, ordinary one-way ANOVA, P **≤0.01, ***≤0.001, ****≤0.0001 compared to the control. (F) Correlation analysis between Pdgfrβ, Vim levels and Gucy1α1 at all the timepoints detected by IF. Pearson r correlation analysis, n = 9 per marker (Control, Day 14, 28, n = 3 per group), r values and P as ****≤0.0001 for each pair are shown on the graphs presenting simple linear regression of correlation between Pdgfrβ and Vim vs. Gucy1α1. Data in scatter plots is presented as mean ± SD.

Update of

References

    1. Henderson, N. C., Rieder, F. & Wynn, T. A. Fibrosis: From mechanisms to medicines. Nature587, 555–566. 10.1038/s41586-020-2938-9 (2020). - PMC - PubMed
    1. Yamashita, N. & Kramann, R. Mechanisms of kidney fibrosis and routes towards therapy. Trends Endocrinol. Metab.35, 31–48. 10.1016/j.tem.2023.09.001 (2024). - PubMed
    1. Li, L., Fu, H. & Liu, Y. The fibrogenic niche in kidney fibrosis: Components and mechanisms. Nat. Rev. Nephrol.18, 545–557. 10.1038/s41581-022-00590-z (2022). - PubMed
    1. Menn-Josephy, H. et al. Renal interstitial fibrosis: An imperfect predictor of kidney disease progression in some patient cohorts. Am. J. Nephrol.44, 289–299. 10.1159/000449511 (2016). - PMC - PubMed
    1. Nath, K. A. Tubulointerstitial changes as a major determinant in the progression of renal damage. Am. J. Kidney Dis.20, 1–17. 10.1016/s0272-6386(12)80312-x (1992). - PubMed

MeSH terms

Substances