. 2025 Jan;31(1):323-331.
doi: 10.1038/s41591-024-03317-8. Epub 2024 Nov 26.

Genetic basis of early onset and progression of type 2 diabetes in South Asians

Collaborators, Affiliations

Genetic basis of early onset and progression of type 2 diabetes in South Asians

Sam Hodgson et al. Nat Med. 2025 Jan.

Abstract

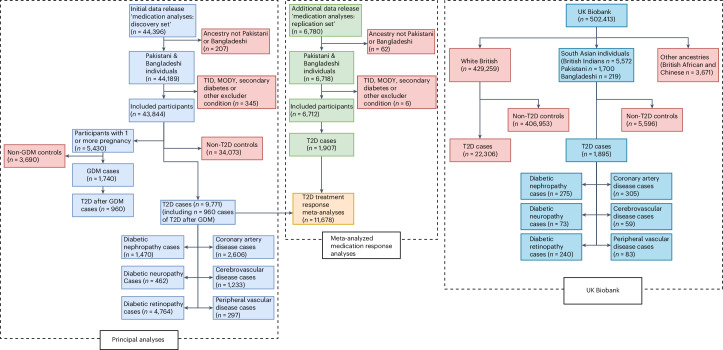
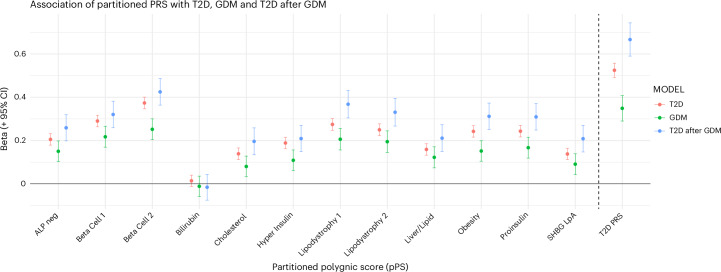
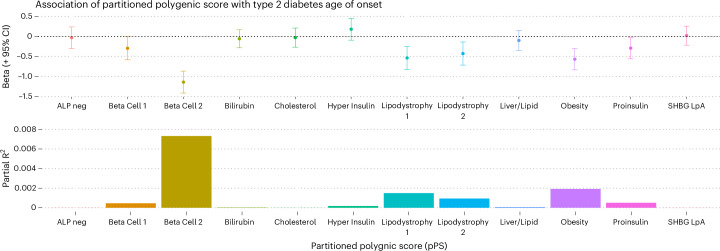
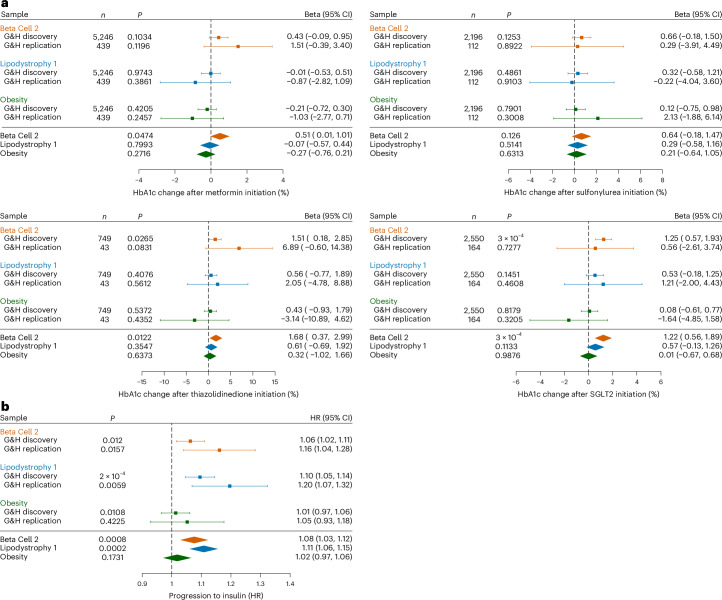
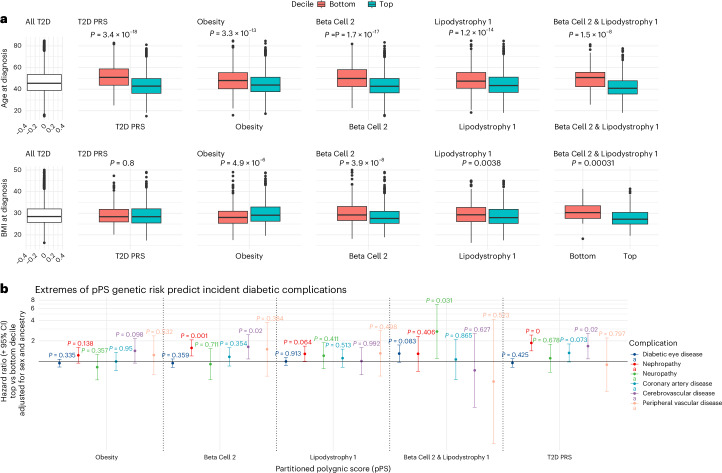
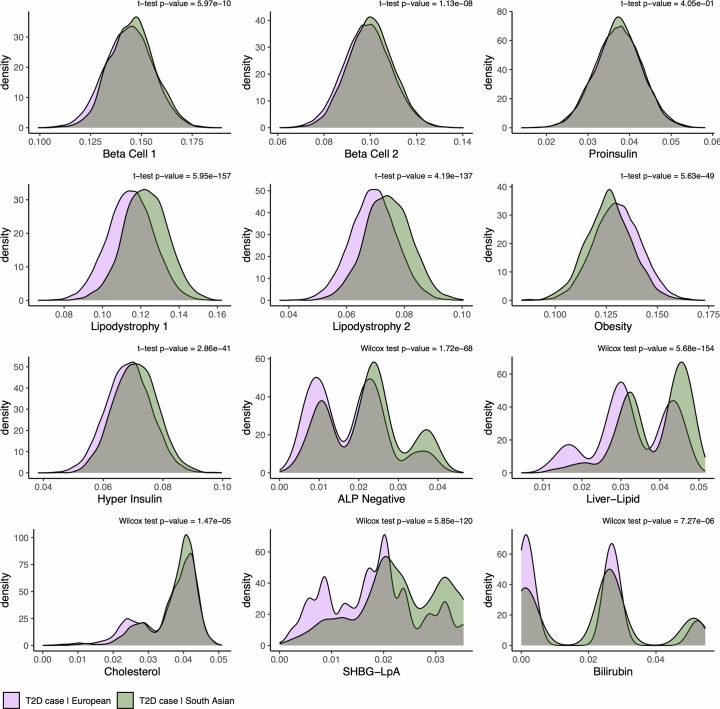
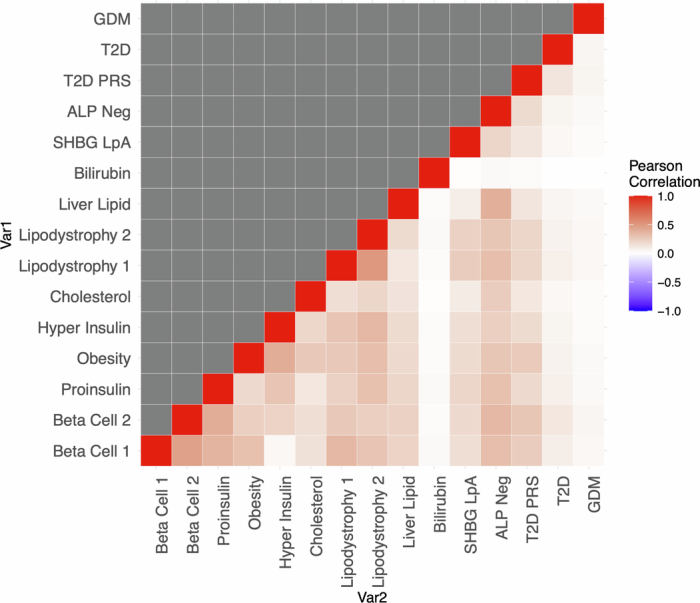
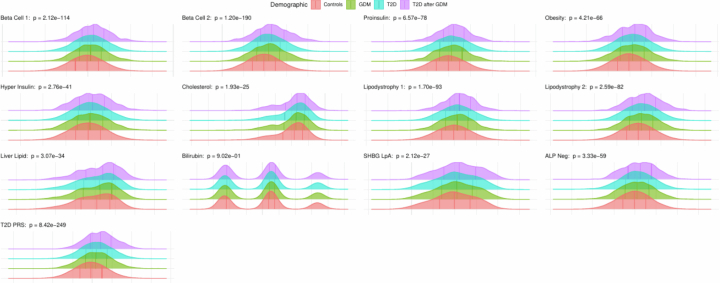
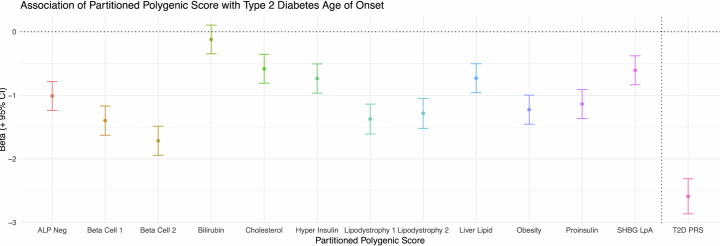
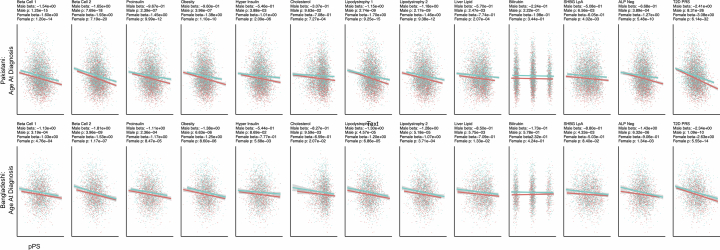
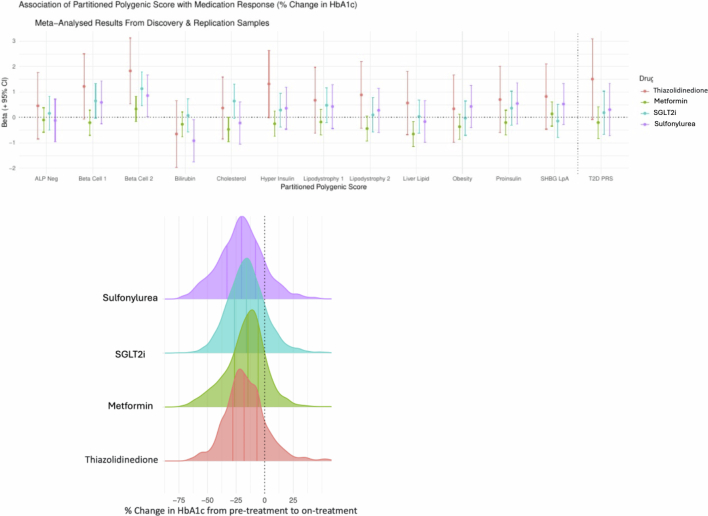
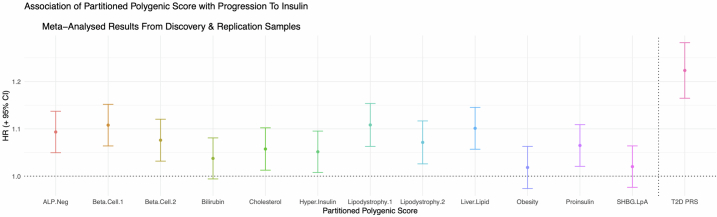
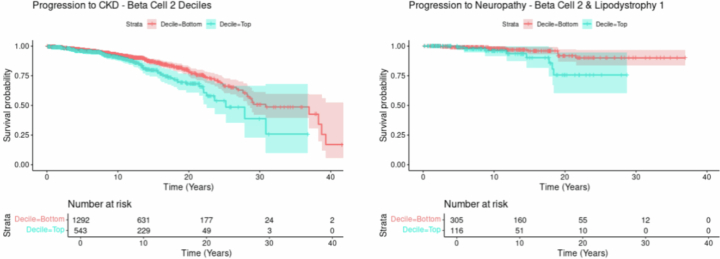
South Asians develop type 2 diabetes (T2D) early in life and often with normal body mass index (BMI). However, reasons for this are poorly understood because genetic research is largely focused on European ancestry groups. We used recently derived multi-ancestry partitioned polygenic scores (pPSs) to elucidate underlying etiological pathways British Pakistani and British Bangladeshi individuals with T2D (n = 11,678) and gestational diabetes mellitus (GDM) (n = 1,965) in the Genes & Health study (n = 50,556). Beta cell 2 (insulin deficiency) and Lipodystrophy 1 (unfavorable fat distribution) pPSs were most strongly associated with T2D, GDM and younger age at T2D diagnosis. Individuals at high genetic risk of both insulin deficiency and lipodystrophy were diagnosed with T2D 8.2 years earlier with BMI 3 kg m-2 lower compared to those at low genetic risk. The insulin deficiency pPS was associated with poorer HbA1c response to SGLT2 inhibitors. Insulin deficiency and lipodystrophy pPSs were associated with faster progression to insulin dependence and microvascular complications. South Asians had a greater genetic burden from both of these pPSs than white Europeans in the UK Biobank. In conclusion, genetic predisposition to insulin deficiency and lipodystrophy in British Pakistani and British Bangladeshi individuals is associated with earlier onset of T2D, faster progression to complications, insulin dependence and poorer response to medication.


Conflict of interest statement

Competing interests: The authors declare no competing interests.

Figures

Fig. 1
Fig. 1. Included participants in the Genes & Health study and the UK Biobank.
Participant flow diagram detailing the number of individuals enrolled in the Genes & Health study and included in each stage of analysis and the number of participants of similar ancestry enrolled in the UK Biobank.
Fig. 2
Fig. 2. Association of pPSs with T2D and GDM risk.
Association of pPSs with incident T2D (n = 9771), GDM (n = 1740) and T2D after GDM (n = 960) in 43,844 individuals in the Genes & Health study. Results for each pPS are presented as beta per s.d. of pPS with 95% CIs after adjustment for sex, age and ancestry. All associations remained statistically significant after Bonferroni correction (other than Bilirubin pPS, which was not associated with any outcome) (Supplementary Table 4). neg, negative.
Fig. 3
Fig. 3. Association of pPS with T2D age of onset in 9,771 British Pakistani and British Bangladeshi individuals in the Genes & Health study.
a, Association between 12 T2D pPSs and age at diagnosis of T2D, presented as beta (in years) per s.d. of pPS, estimated from a multivariable logistic regression model incorporating all 12 pPSs and adjusted for sex and ancestry. b, Partial R2 for effect of 12 diabetes pPSs on age at T2D diagnosis, estimated from the same model. After correction for multiple testing, only Beta Cell 2, Lipodystrophy 1 and Obesity pPSs were associated with age at diagnosis. neg, negative.
Fig. 4
Fig. 4. Association of pPSs with anti-diabetic medication initiation and response.
a, Association of pPSs with change in HbA1c in response to medication initiation, presented as beta per s.d. (± 95% CIs and two-sided P values from t statistic), estimated from multivariable regression models adjusted for sex and ancestry. The change presented is mean percent change in HbA1c from pre-treatment to on-treatment; HbA1c units are mmol mol−1. After adjustment for multiple testing, the only association that was statistically significant was that of Beta Cell 2 pPS with SGLT2i response (further details are presented in Supplementary Table 6). Sulfonylurea, insulin secretagogues, including sulfonylureas and meglitinides (n = 2,196); Metformin, metformin (n = 5,246); SGLT2i, sodium/glucose co-transporter 2 inhibitors (n = 2,550); Thiazolidinedione, pioglitazone/thiazolidinediones (n = 749). b, Insulin-free survival from time of T2D diagnosis in 9,756 individuals for whom prescribing data were available (number of cases = 1,756), presented as HRs (± 95% CIs) estimated from Cox proportional hazard survival models adjusted for sex and genetically determined ancestry; presented P values are two-sided. Results for Beta Cell 2 and Lipodystrophy 1 pPSs were statistically significant after adjustment for multiple testing (Supplementary Table 7). G&H, Genes & Health.
Fig. 5
Fig. 5. pPS genetic risk extremes, T2D phenotype and complications.
Extremes of genetic risk association with age (a) and BMI (b) at diagnosis and progression to microvascular complications (c), among 9,771 individuals with T2D in the Genes & Health study. For a and b, box plots are presented contrasting individuals in the top and bottom 10% of the genetic risk distributions for three key pPSs (Obesity (n = 1,120 top decile/708 bottom decile), Beta Cell 2 (n = 1,309 top/566 bottom) and Lipodystrophy 1 (n = 1,164 top/635 bottom)) and a global T2D PRS (n = 1,385 top/508 bottom) and for individuals in the top and bottom 10% of both the Beta Cell 2 and Lipodystrophy distributions (n = 291 top/83 bottom) (right-most panel). Distributions for all individuals with T2D are presented in the left-most panel for comparison (n = 9,771). The middle line of each box represents the median value; the upper and lower bounds of the box represent the upper and lower quartiles; and the whiskers are defined as upper or lower quartile plus or minus 1.5 times the interquartile range. Distributions were compared using two-way ANOVA; all statistically significant associations remained after Bonferroni correction. For c, HRs are presented for each genetic risk extreme comparison, comparing complication-free survival from diagnosis between the bottom 10% of each pPS distribution (reference) and the top 10%. HRs were estimated from Cox proportional hazard models adjusted for sex and ancestry. After Bonferroni correction, only associations between nephropathy and Beta Cell 2 and T2D PRS remained significant (Supplementary Table 8). Further data are presented in Supplementary Table 9 (Schoenfeld residuals for survival models) and Extended Data Fig. 10 (illustrative Kaplan–Meier survival plots for positive results).
Extended Data Fig. 1
Extended Data Fig. 1. Partitioned polygenic score (pPS) distributions before and after ancestry adjustment.
Density plots to show the distribution of 12 diabetes partitioned polygenic scores and one type 2 diabetes polygenic risk score before (top row) and after (bottom row) residual pPS/PRS calculation, by regressing out the effects of principal components 1–10 on each pPS/PRS, in 44,189 individuals in the genes & Health study. Plots are stratified by genetically-determined ancestry.
Extended Data Fig. 2
Extended Data Fig. 2. Comparison of pPS distributions between south Asians and white Europeans in UK biobank.
Multi-ancestry pPS distribution comparisons. pPS distributions are shown for EUR and SAS individuals enrolled in UK Biobank. Test statistics are found in supplementary Table 4. The only non-significant difference was in the proinsulin pPS.
Extended Data Fig. 3
Extended Data Fig. 3. Association of pPS with metabolic traits at the time of type 2 diabetes diagnosis.
Association between 12 diabetes partitioned polygenic scores (pPS) and z-normalised diabetes-related traits at the time of diagnosis in 9771 south Asian individuals with a diagnosis of type 2 diabetes. Data are presented as spider plots for each pPS, showing beta per standard deviation of pPS; the minimum value on each trait axis (comparable between pPS) represents the lowest beta for any pPS for that trait; the maximum value represents the highest beta for any pPS for that trait. EG, BMI and Waist circumference are highest in the ‘Obesity’ pPS; ALP is lowest in the ‘ALP Neg’ pPS. To allow comparison between traits, all traits were z-scored to a normal distribution with mean and median of 0 and standard deviation of 1. Only trait values within 1 year of diagnosis were included in analysis; where more than one trait was present, the value closest to time of diagnosis was used. ALP - alkaline phosphatase (n = 7422). ALT - alanine transferase (n = 7631). BMI - body mass index (n = 5791). HDL - high density lipoprotein (n = 7304). LDL = low density lipoprotein (n = 6365). RPG - random plasma glucose(n = 3777). FPG - fasting plasma glucose (n = 4786). Trigs - serum triglycerides (n = 6357). Waist - waist circumference (n = 1922). HbA1c = glycated haemoblogin (n = 7326).
Extended Data Fig. 4
Extended Data Fig. 4. Correlation heatmap of pPS.
Heatmap showing correlation between 12 diabetes partitioned polygenic scores, type 2 diabetes polygenic risk score (T2D PRS), type 2 diabetes status (T2D) and gestational diabetes mellitus status (GDM) in 43,844 individuals enrolled in the Genes & Health study.
Extended Data Fig. 5
Extended Data Fig. 5. Stratified distributions of pPS by type 2 diabetes and gestational diabetes status.
Distribution of 12 ancestry-corrected partitioned polygenic scores, and type 2 diabetes polygenic risk score (T2D PRS), in 43,844 individuals enrolled in Genes & Health. Density plots are presented for each score, stratified by T2D status (non-diabetic control; gestational diabetes mellitus (GDM); type 2 diabetes (T2D); and individuals developing T2D after GDM. p values for each plot compare differences between strata – two-way ANOVA was used for normally-distributed variables, and Kruskal Wallis test for non-normal variables (bilirubin).
Extended Data Fig. 6
Extended Data Fig. 6. Unadjusted association of pPS with age at type 2 diabetes diagnosis.
Association of twelve partitioned polygenic scores and a global type 2 diabetes polygenic risk score (T2D PRS) with type 2 diabetes age of onset in 9771 individuals. Results are presented as beta per standard deviation in score. Each beta was estimated from a separate multivariable regression model, adjusted for sex and ancestry.
Extended Data Fig. 7
Extended Data Fig. 7. Association of pPS with age at type 2 diabetes diagnosis, stratified by sex and ancestry.
Sex- and ancestry-stratified associations between 12 partitioned polygenic scores (pPS), a type 2 diabetes polygenic risk score (T2D PRS), and age at diagnosis of type 2 diabetes, in 9771 male (Blue line) and female (red line) Pakistani (bottom row) and Bangladeshi (top row) individuals with type 2 diabetes in the Genes & Health study. Sex- and ancestry-specific lines of best fit with 95% confidence intervals are plotted for each pPS, with male and female betas estimated from univariate logistic regression models regressing age at diagnosis on each pPS presented in each panel heading.
Extended Data Fig. 8
Extended Data Fig. 8. Partitioned polygenic scores and response to diabetes-controlling medication.
Top panel: Association of pPS with mean change in HBA1c (+/− 95% confidence intervals) in response to medication initiation, presented as beta per standard deviation, estimated from multivariable regression models adjusted for sex and ancestry. Bottom panel: Distribution of percentagechange in HbA1c after initiation of 5 classes of oral antidiabetic medication, calculated as on-treatment HbA1c minus pre-treatment HbA1c, expressed as a percentage of pre-treatment HbA1c. Sulfonylurea = insulin secretagogiues (sulfonylureas and meglitinides, n = 2196), Metformin = metformin (n = 5246), SGLT2i = sodium/glucose contransporter 2 inhibitors (n = 2550), Thiazolidinedione = pioglitazone / thiazolidinediones (n = 749).
Extended Data Fig. 9
Extended Data Fig. 9. Partitioned polygenic scores and progression to insulin.
Association between twelve diabetes partitioned polygenic scores (pPS) and a global type 2 diabetes polygenic risk score (T2D PRS) and progression from time of type 2 diagnosis to insulin therapy initiation, meta-analysed from discovery and replication samples, in 11,678 individuals followed up for 138,769 person-years post-diagnosis. Data are presented as Hazard ratios (HR) +/− 95% confidence intervals ascertained from cox proportional hazards survival models adjusted for sex and genetically determined ancestry.
Extended Data Fig. 10
Extended Data Fig. 10. Extremes of genetic risk and progression to complications.
Kaplan-Meier plots for progression to complications (nephropathy and neuropathy) from time of type 2 diabetes diagnosis in 9771 individuals in Genes & health. Plots are presented for only those results which were statistically significant in multivariable survival models adjusted for age and ancestry (Fig. 4c). Strata are defined as ‘extremes of genetic risk’ - in the left-hand plot, individuals in the top decile of the Beta Cell 2 pPS distribution are compared to those in the bottom decile. In the right hand plot, individuals in the top deciles of both the beta Cell 2 and Lipodystrophy 1 distributions are compared to those in the bottom of both distributions. Shaded areas indicate 95% confidence intervals.

References

    1. Magliano, D. & Boyko, E. J. IDF Diabetes Atlas (International Diabetes Federation, 2021).
    1. Gujral, U. P., Pradeepa, R., Weber, M. B., Narayan, K. M. V. & Mohan, V. Type 2 diabetes in South Asians: similarities and differences with white Caucasian and other populations. Ann. N. Y. Acad. Sci.1281, 51–63 (2013). - PMC - PubMed
    1. Wright, A. K. et al. Age-, sex- and ethnicity-related differences in body weight, blood pressure, HbA1c and lipid levels at the diagnosis of type 2 diabetes relative to people without diabetes. Diabetologia63, 1542–1553 (2020). - PMC - PubMed
    1. Siddiqui, M. K. et al. Young-onset diabetes in Asian Indians is associated with lower measured and genetically determined beta cell function. Diabetologia65, 973–983 (2022). - PMC - PubMed
    1. Farrar, D. et al. Association between hyperglycaemia and adverse perinatal outcomes in south Asian and white British women: analysis of data from the Born in Bradford cohort. Lancet Diabetes Endocrinol.3, 795–804 (2015). - PMC - PubMed

MeSH terms

LinkOut - more resources