. 2024 Dec;20(12):1282-1302.
doi: 10.1038/s44320-024-00072-3. Epub 2024 Nov 26.

Understanding the biological processes of kidney carcinogenesis: an integrative multi-omics approach

Affiliations

Understanding the biological processes of kidney carcinogenesis: an integrative multi-omics approach

Ricardo Cortez Cardoso Penha et al. Mol Syst Biol. 2024 Dec.

Abstract

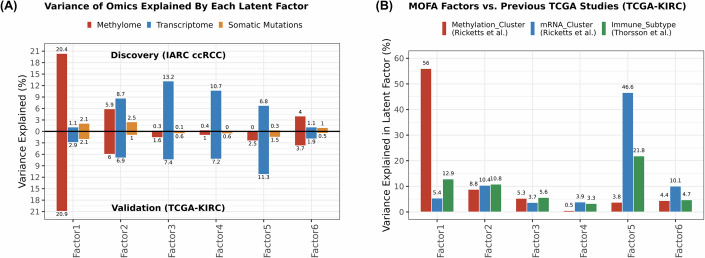
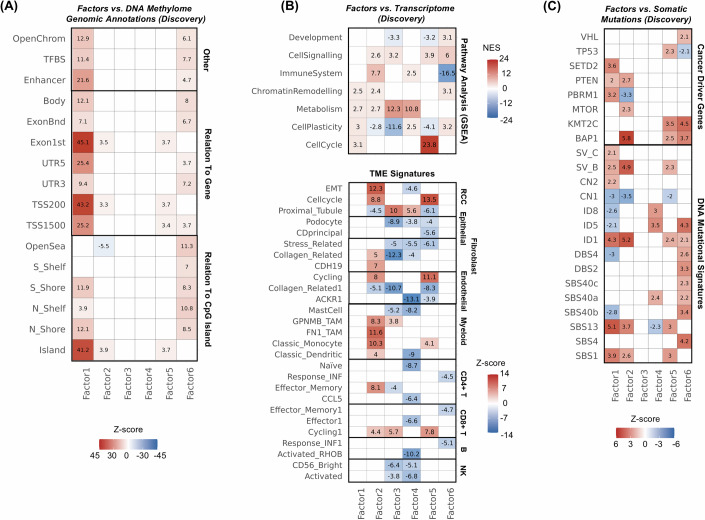
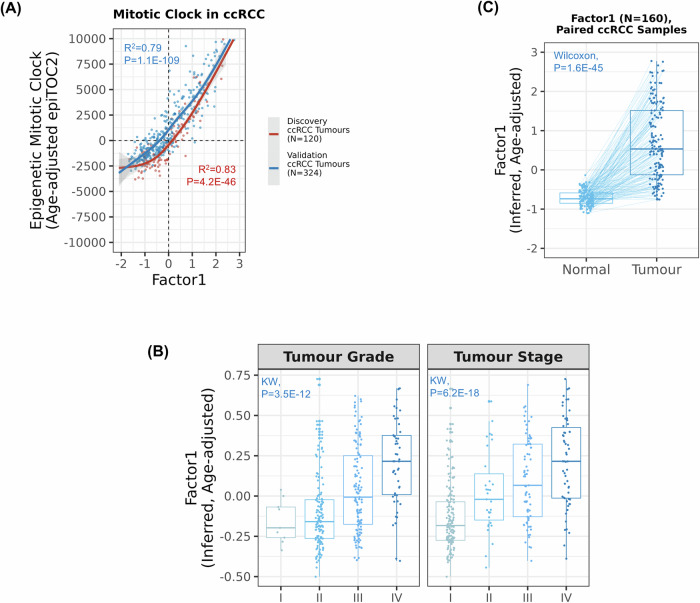
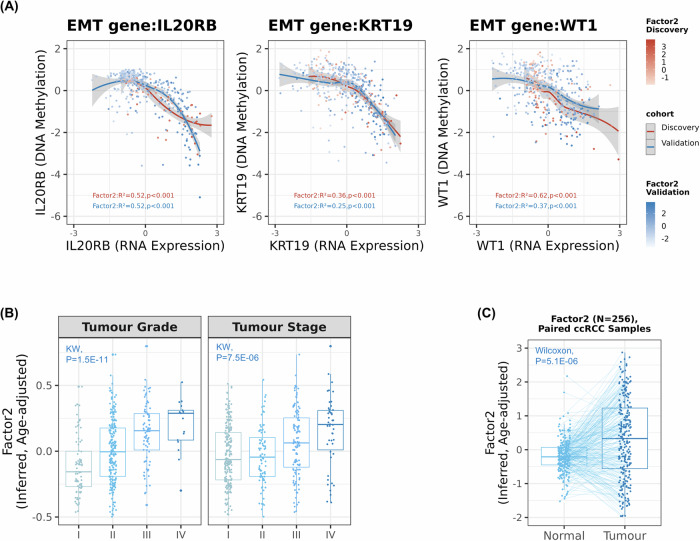
Biological mechanisms related to cancer development can leave distinct molecular fingerprints in tumours. By leveraging multi-omics and epidemiological information, we can unveil relationships between carcinogenesis processes that would otherwise remain hidden. Our integrative analysis of DNA methylome, transcriptome, and somatic mutation profiles of kidney tumours linked ageing, epithelial-mesenchymal transition (EMT), and xenobiotic metabolism to kidney carcinogenesis. Ageing process was represented by associations with cellular mitotic clocks such as epiTOC2, SBS1, telomere length, and PBRM1 and SETD2 mutations, which ticked faster as tumours progressed. We identified a relationship between BAP1 driver mutations and the epigenetic upregulation of EMT genes (IL20RB and WT1), correlating with increased tumour immune infiltration, advanced stage, and poorer patient survival. We also observed an interaction between epigenetic silencing of the xenobiotic metabolism gene GSTP1 and tobacco use, suggesting a link to genotoxic effects and impaired xenobiotic metabolism. Our pan-cancer analysis showed these relationships in other tumour types. Our study enhances the understanding of kidney carcinogenesis and its relation to risk factors and progression, with implications for other tumour types.

Keywords: Cancer Biology; Genomic Epidemiology; Integrative Multi-omics Analysis; Kidney Cancer; Tumour Microenvironment.


Conflict of interest statement

Disclosure and competing interests statement. The authors declare no competing interests. Where authors are identified as personnel of the International Agency for Research on Cancer/World Health Organization, the authors alone are responsible for the views expressed in this article and they do not necessarily represent the decisions, policies, or views of the International Agency for Research on Cancer/World Health Organization. This study was conducted in accordance with the ethical principles outlined in the Declaration of Helsinki. Informed consent was obtained for all participants included in the discovery and validation sets. Ethical approvals were obtained from Local and Federal Research Ethics Committees, and from the IARC Ethics Committee (IEC Project 17-10A4). For the TCGA datasets, also used as validation set, the enrolling, collection, clinical and genomic data processing and distributions are subject to 45-CFR-46 (the “Common Rule”) governing protection of human research subjects. Under the revised TCGA consent policy, re-consent of still-living participants is no longer a programme-imposed requirement. The Project Team described the best practices for informed consent for participating in TCGA in this memo ( http://cancergenome.nih.gov/abouttcga/policies/informedconsent ).

Figures

Figure 1
Figure 1. Overview of latent factors 1–6.
(A) Percentage of variance in each omic layer across tumour samples from the discovery set (upper bars; all molecular variables included in the Multi-Omics Factor Analysis; IARC ccRCC: N = 151 tumours) and validation dataset (bottom bars; latent factor signatures; TCGA-KIRC: N = 324 tumours) explained by latent factor. Methylome (DNA methylation) in red, transcriptome (microarray) in blue, and somatic mutations (cancer driver mutations and DNA mutational signatures derived from whole-genome sequencing data for the discovery set and whole-exome sequencing data for the validation set) in orange. (B) To estimate the percentage of variance explained in each latent factor (factors 1–6) explained by the single-omic clusters derived from previous TCGA studies, we applied linear regression models where each latent factor was the outcome, and each omic cluster derived from previous TCGA studies was the predictor. This included three DNA methylation clusters and four mRNA clusters (Ricketts et al, 2018), as well as six expression-based immune subtypes (Thorsson et al, 2018). The models provided adjusted R2 values, representing the variance explained by each omic cluster in the respective latent factor.
Figure 2
Figure 2. Associations between latent factors and molecular features of ccRCC tumours in the discovery set.
Heatmaps showing the Z-scores (beta divided by standard error) of linear regression analyses between latent factors (outcome) and molecular features related to the three omics layers included in the Multi-Omics Factor Analysis (MOFA), adjusting by age at diagnosis and sex. (A) For the DNA methylome layer (N = 120), the average beta methylation levels of the 5000 MOFA CpG sites by genomic annotation related to CpG island (island, shores, shelves, and open sea), gene (proximal/TSS200 and distal/TSS1500 promoters, UTRs, exons, and body), and other regulatory regions (open chromatin, transcription factor binding site/TFBS, and enhancer) were used as predictors. (B) For the transcriptome layer, pathway analysis was conducted on the top 500 genes correlated with each latent factor using the GSEA database and fgsea R package (v1.27.1). The top 10 enriched biological pathways for each latent factor (FDR < 0.05) were manually categorised into functional groups based on their descriptions in the GSEA database and the canonical functions of the associated genes, including development, cell signalling, immune system, chromatin remodelling, metabolism, cell plasticity, and cell cycle. We then summed the normalised enrichment scores (NES), provided by the pathway analysis, by functional category to represent the major biological processes enriched for each latent factor. For the tumour microenvironment (TME) gene expression signatures, it was shown the statistically significant associations between latent factors 1 to 6 and the 27 representative TME signatures in ccRCC tumours. The association estimates were derived from the analyses in the validation sets (IARC ccRCC series: 462 tumours for LF 2–5; TCGA-KIRC: 323 tumours for LF1 and 6) after adjustments by covariates (sex, age at diagnosis, and country of origin whenever possible). Associations that passed multiple-testing correction (false discovery rate/FDR < 0.05, 162 tests) were represented. The associations were represented as Z-scores (beta divided by standard error; Z-scores >0 in shades of red; Z-score <0 in shades of blue). The ccRCC tumour microenvironment signatures (CD4 + T, B, NK, endothelial, myeloid, CD8 + T, epithelial and fibroblast cells) and kidney cancer meta programmes/RCC (epithelial-to-mesenchymal transition/EMT and cell cycle) were derived from previous published single-cell RNA sequencing data (Li et al, 2022). (C) The somatic mutation profile based on whole-genome sequence data (WGS, N = 151) was represented by ccRCC driver mutations (binary; presence or absence) and DNA mutational signatures (continuous). Regression models included age at diagnosis, sex, and country of origin as covariates. Values represented as shades of red (Z-scores >0) and blue (Z-score <0). The associations that passed multiple-testing correction (FDR < 0.05) within each group of variables were represented. Tobacco-related (SBS4, DBS2), clock-like (SBS1, ID1), APOBEC (SBS13), copy number (CN) and structural variation (SV) DNA mutational signatures. Source data are available online for this figure.
Figure 3
Figure 3. Relationship between latent factor 1, the mitotic-like epigenetic clock epiTOC2, and prognosis.
Analyses were performed using the residuals of the cellular mitotic age epigenetic clock epiTOC2 after adjusting by chronological age. (A) Smooth regression lines between latent factor 1 and the age-adjusted epiTOC2 (Discovery (red dots): 120 tumours, Validation/TCGA-KIRC (blue dots): 324 tumours) in ccRCC tumours. P values derived from linear regression models (Factor 1 ~age-adjusted epiTOC2). (B) Age-adjusted residuals of latent factor 1 across different ccRCC tumour stages (N = 322) and grades (N = 320) from TCGA validation set (N = 323). Statistical comparison between medians was performed using Kruskal-Wallis’s test. (C) Comparison of medians of paired normal adjacent kidney tissues (light blue) and ccRCC tumours (dark blue) for age-adjusted latent factor 1 (TCGA-KIRC: 160 normal-tumour pairs). Lines connect matched samples. P values from Wilcoxon signed-rank test. The boxplots depict the distribution of the data with the central line representing the median (50th percentile). The bounds of the box correspond to the interquartile range (IQR), extending from the 25th percentile (lower quartile) to the 75th percentile (upper quartile). The whiskers show the minimum and maximum values within 1.5 times the IQR from the quartiles, while data points beyond the whiskers are considered outliers. P values < 0.05 were considered statistically significant. Observed latent factor 1 used for the regression models in the discovery set while the latent factor 1 signature was used for the analyses in the validation set.
Figure 4
Figure 4. Relationship between latent factor 2 and epithelial–mesenchymal transition process (EMT).
(A) Smooth regression lines between the average DNA methylation and RNA levels of EMT genes (IL20RB, KRT19, and WT1). Each dot was coloured by the values of latent factor 2 in the discovery (shades of red; IARC ccRCC: 120 tumours) and validation sets (shades of blue; TCGA-KIRC: 323 tumours). The proportion of variance of latent factor 2 explained by both DNA methylation and RNA levels of each gene was calculated by linear regression models. The regression model provided adjusted R2 values and P values (Discovery: PIL20RB = 2 × 10−16 (DNAm) and 3 × 10−18 (RNA), PKRT19 = 5 × 10⁻⁸ (DNAm) and 1 × 10−15 (RNA), PWT1 = 6 × 10−25 (DNAm) and 1 × 10−9 (RNA); Validation: PIL20RB = 2 × 10−29 (DNAm) and 1 × 10−49 (RNA), PKRT19 = 5 × 10−8 (DNAm) and 9 × 10−26 (RNA), PWT1 = 3 × 10−32 (DNAm) and 2 × 10−16 (RNA)). (B) Residuals of latent factor 2 signature after adjusting by chronological age were plotted across different ccRCC tumour stages (322 tumours) and grades (320 tumours) from TCGA validation set (323 tumours). P values from Kruskal–Walis’s test. (C) Comparison of paired normal adjacent kidney tissues (light blue) and ccRCC tumours (dark blue) for age-adjusted latent factor 2 (IARC ccRCC validation set: 256 normal-tumour pairs). Lines connect matched samples. The boxplots depict the distribution of the data with the central line representing the median (50th percentile). The bounds of the box correspond to the interquartile range (IQR), extending from the 25th percentile (lower quartile) to the 75th percentile (upper quartile). The whiskers show the minimum and maximum values within 1.5 times the IQR from the quartiles, while data points beyond the whiskers are considered outliers. P values from Wilcoxon signed rank. P values < 0.05 were considered statistically significant.
Figure 5
Figure 5. Associations between latent factor 6 and molecular features related to exogenous exposures in ccRCC tumours.
(A) Forest plot showing the results of multivariable regression analyses of latent factor 6 (outcome) and GSTP1 methylation (Average m-values of CpG sites annotated to GSTP1, DNAm, continuous) and gene expression levels (RNA, continuous), and DNA methylation signature of tobacco smoking trained to predict self-reported tobacco smoking status (5 CpG sites, continuous, epiTob), and total mutation burden (whole-genome for discovery and whole-exome for validation) in both discovery (120 tumours for DNA methylation and 151 for gene expression data) and validation (TCGA-KIRC; 324 tumours; 268 cases with total mutation burden analysis) sets. Covariates used in the regression models were sex, age at diagnosis, and country of origin (whenever possible). For analyses of total mutation burden, ccRCC cases from Romania (N = 31) were excluded from the discovery set. Beta estimates were represented as an increase in the effect of the selected features per 1 unit of standard deviation increase in latent factor 6. Blue dots when discovery and red dots when validation ccRCC tumour cohorts. P values < 0.05, derived from the linear regression models, were considered statistically significant. Observed latent factor 6 used for the regression models in the discovery set while a signature was used for the analyses in the validation set. (B) Comparison of paired normal adjacent kidney tissues (light blue) and ccRCC tumours (dark blue) for age-adjusted latent factor 6 (TCGA-KIRC: 160 normal-tumour pairs). Lines connect matched samples. The boxplots depict the distribution of the data with the central line representing the median (50th percentile). The bounds of the box correspond to the interquartile range (IQR), extending from the 25th percentile (lower quartile) to the 75th percentile (upper quartile). The whiskers show the minimum and maximum values within 1.5 times the IQR from the quartiles, while data points beyond the whiskers are considered outliers. P values from the Wilcoxon signed-rank test P values < 0.05 were considered statistically significant.
Figure EV1
Figure EV1. Study design.
(Upper) For the discovery set (IARC series), we used DNA methylation (120 tumours), transcriptome (151 tumours), and somatic mutation profile derived from whole-genome sequencing data of the overlapping clear cell renal cell carcinoma (ccRCC) tumour samples (151 tumours) to perform a Multi-Omics Factor Analysis (MOFA) to uncover the sources of inter-patient variation in the ccRCC data. For these analyses, the top 5000 most variable features within DNA methylation (continuous variables; M-values) and transcriptome data (continuous variables; log2-transcripts per million) along with DNA mutational signatures and cancer driver mutations (binary variables; presence or absence) derived from whole-genome sequencing were used as inputs to MOFA. The output of MOFA was 10 orthogonal latent factors. The first six latent factors were selected using the elbow method. In parallel, no additional associations between latent factors 7 to 10 and epidemiological data were observed (more details in Table EV5). (Bottom) For validation purposes, we used Least Absolute Shrinkage and Selection Operator (LASSO) regression models to select the most informative independent features correlated with each latent factor, CpG sites or gene expression levels since these two omics layers accounted for over 90% of inter-patient’s variability in the discovery set, and based on them, we calculated signatures to infer the latent factors in tumour and paired normal adjacent/tumour samples in two independent datasets (TCGA-KIRC: 324 and 160 normal-tumour pairs; IARC ccRCC series: 462 tumours).
Figure EV2
Figure EV2. Molecular components associated with prognosis of ccRCC patients.
Cox proportional-hazards models for assessing overall survival of ccRCC patients in relation to latent factor 1 (mitotic-like epigenetic clock epiTOC2), 2 (epithelial–mesenchymal transition/EMT), and 5 (cell cycle), adjusting for age at diagnosis, sex (model 1; circle shape), and additionally by tumour stage and grade (I + II vs. III + IV; model 2; square shape) in the discovery (red) and validation (blue) datasets. Hazard ratios (HR) represented as an increase in relative mortality risk per 1 unit of standard deviation increase in factors. Two different validation sets were used according to the factors, TCGA-KIRC (a; 324 kidney tumour samples) for latent factor 1 and IARC series sets (b; 462 kidney tumour samples) for latent factors 2 and 5. Observed latent factors used for the regression models in the discovery set while signatures for the same latent factors were used for the analyses in the validation sets. P values < 0.05, derived from Cox proportional-hazards models, were considered statistically significant.
Figure EV3
Figure EV3. Validation of the associations between latent factors and molecular features of ccRCC tumours in the independent ccRCC datasets.
For validation purposes, only the statistically significant associations in the discovery set were considered in the validation phase. Heatmaps showing the Z-scores (beta divided by standard error) of linear regression analyses between latent factor signatures (outcome) and genomic annotations and features related to the three omics layers, adjusting by age at diagnosis and sex. (A) For the DNA methylome layer (TCGA-KIRC: 324 tumours for DNA methylation-related latent factors 1 and 6; and 323 cases for the expression-related ones, latent factors 2–5), the average beta methylation levels of the 4,000 CpG sites that overlapped with discovery set were summarised by genomic annotations related to CpG island (island, shores, shelves, and open sea), gene (proximal/TSS200 and distal/TSS1500 promoters, UTRs, exons, and body), and other regulatory regions (open chromatin, transcription factor binding site/TFBS, and enhancer) and used as predictors. (B) For the transcriptome layer, pathway analysis was performed for the top 500 gene expression levels correlated with each latent factor using the GSEA database and fgsea R package (v1.27.1). Biological pathways present in the discovery set with P value < 0.05 were manually categorised into functional groups based on their descriptions in the GSEA database and the canonical functions of the associated genes, including Development, Cell Signalling, Immune System, Chromatin Remodelling, Metabolism, Cell Plasticity, and Cell Cycle. We then summed the normalised enrichment scores (NES), provided by the pathway analysis, by functional category to represent the major biological processes enriched for each latent factor. For the tumour microenvironment (TME) gene expression signatures, it was shown the statistically significant associations between latent factors 1 to 6 and the 27 representative TME signatures in ccRCC tumours. The association estimates were derived from the analyses in the validation sets (IARC ccRCC series: 462 tumours for latent factors 2–5; TCGA-KIRC: 323 tumours for latent factors 1 and 6) after adjustments by covariates (sex, age at diagnosis, and country of origin whenever possible. The associations were represented as Z-scores (beta divided by standard error; Z-scores>0 in shades of red; Z-score<0 in shades of blue). The ccRCC tumour microenvironment signatures (CD4 + T, B, NK, endothelial, myeloid, CD8 + T, epithelial and fibroblast cells) and kidney cancer meta programmes/RCC (epithelial-to-mesenchymal transition/EMT and cell cycle) were derived from previous single-cell RNA sequencing data (Li et al, 2022). (C) The somatic profile based on whole-exome sequencing data (TCGA-KIRC: 268 tumours) was represented by ccRCC somatic driver mutations (binary; presence or absence) and DNA mutational signatures (continuous). Regression models included age at diagnosis, sex, and country of origin as covariates. Values represented as shades of red (Z-scores>0) and blue (Z-score<0). The associations with P < 0.05, derived from linear regression models, were represented. Tobacco-related (SBS4, DBS2), clock-like (SBS1, ID1), APOBEC (SBS13), copy number (CN) and structural variation (SV) DNA mutational signatures. Source data are available online for this figure.
Figure EV4
Figure EV4. Correlation between latent factor 1 and epigenetic clocks.
Heatmap represents the Pearson’s correlation coefficients between the residuals of epigenetic clocks and latent factor 1 after adjusting by chronological age in ccRCC tumours from (A) IARC discovery (120 tumours) and (B) validation (TCGA-KIRC: 324 tumours) sets with DNA methylation data. Horvath’s (Horvath et al, , Horvath et al, 2018), Hannum’s (Hannum et al, 2013), and Zhang’s (Zhang et al, 2019) clocks trained on chronological age. EpiTOC2 is designed to predict mitotic cell rate. Zhang’s (Zhang et al, 2017), Levine’s (Levine et al, 2018), and DunedinPACE (Belsky et al, 2022) clocks to predict mortality risk. Lu’s (Lu et al, 2019) to predict telomere length.
Figure EV5
Figure EV5. BAP1 mutations and the epigenetic regulation of epithelial–mesenchymal transition (EMT) genes in ccRCC tumours.
Comparison of paired DNA methylation (DNAm) and RNA levels of EMT genes (IL20RB, KRT19, and WT1) in ccRCC tumours in the discovery (IARC ccRCC: 120 tumours; lines and dots in red) and validation cohorts (TCGA-KIRC: 268 tumours) by BAP1 driver mutation status (wild-type: BAP1 WT or mutated: BAP1 MUT). Lines connect matched samples. The boxplots depict the distribution of the data with the central line representing the median (50th percentile). The bounds of the box correspond to the interquartile range (IQR), extending from the 25th percentile (lower quartile) to the 75th percentile (upper quartile). The whiskers show the minimum and maximum values within 1.5 times the IQR from the quartiles, while data points beyond the whiskers are considered outliers. P values from Wilcoxon signed-rank. P values < 0.05 were considered statistically significant.

References

    1. Alexandrov LB, Jones PH, Wedge DC, Sale JE, Campbell PJ, Nik-Zainal S, Stratton MR (2015) Clock-like mutational processes in human somatic cells. Nat Genet 47:1402–1407 - PMC - PubMed
    1. Alexandrov LB, Kim J, Haradhvala NJ, Huang MN, Tian Ng AW, Wu Y, Boot A, Covington KR, Gordenin DA, Bergstrom EN et al (2020) The repertoire of mutational signatures in human cancer. Nature 578:94–101 - PMC - PubMed
    1. Argelaguet R, Velten B, Arnol D, Dietrich S, Zenz T, Marioni JC, Buettner F, Huber W, Stegle O (2018) Multi-Omics factor analysis—a framework for unsupervised integration of multi-omics data sets. Mol Syst Biol 14:e8124 - PMC - PubMed
    1. Barthel FP, Wei W, Tang M, Martinez-Ledesma E, Hu X, Amin SB, Akdemir KC, Seth S, Song X, Wang Q et al (2017) Systematic analysis of telomere length and somatic alterations in 31 cancer types. Nat Genet 49:349–357 - PMC - PubMed
    1. Bell CG, Lowe R, Adams PD, Baccarelli AA, Beck S, Bell JT, Christensen BC, Gladyshev VN, Heijmans BT, Horvath S et al (2019) DNA methylation aging clocks: challenges and recommendations. Genome Biol 20:249 - PMC - PubMed

MeSH terms

LinkOut - more resources