

Relaxation-exchange magnetic resonance imaging (REXI): a non-invasive imaging method for evaluating trans-barrier water exchange in the choroid plexus
- PMID: 39593112
- PMCID: PMC11590242
- DOI: 10.1186/s12987-024-00589-7
Relaxation-exchange magnetic resonance imaging (REXI): a non-invasive imaging method for evaluating trans-barrier water exchange in the choroid plexus
Abstract
Background: The choroid plexus (CP) plays a crucial role in cerebrospinal fluid (CSF) production and brain homeostasis. However, non-invasive imaging techniques to assess its function remain limited. This study was conducted to develop a novel, contrast-agent-free MRI technique, termed relaxation-exchange magnetic resonance imaging (REXI), for evaluating CP-CSF water transport, a potential biomarker of CP function.
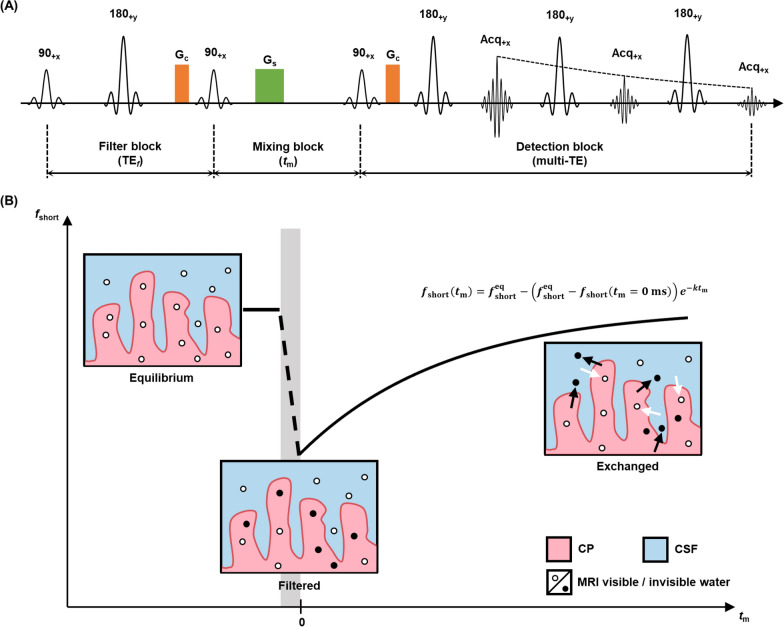
Methods: REXI utilizes the inherent and large difference in magnetic resonance transverse relaxation times (T2s) between CP tissue (e.g., blood vessels and epithelial cells) and CSF. It uses a filter block to remove most CP tissue magnetization (shorter T2), a mixing block for CP-CSF water exchange with mixing time tm, and a detection block with multi-echo acquisition to determine the CP/CSF component fraction after exchange. The REXI pulse sequence was implemented on a 9.4 T preclinical MRI scanner. For validation of REXI's ability to measure exchange, we conducted preliminary tests on urea-water proton-exchange phantoms with various pH levels. We measured the steady-state water efflux rate from CP to CSF in rats and tested the sensitivity of REXI in detecting CP dysfunction induced by the carbonic anhydrase inhibitor acetazolamide.
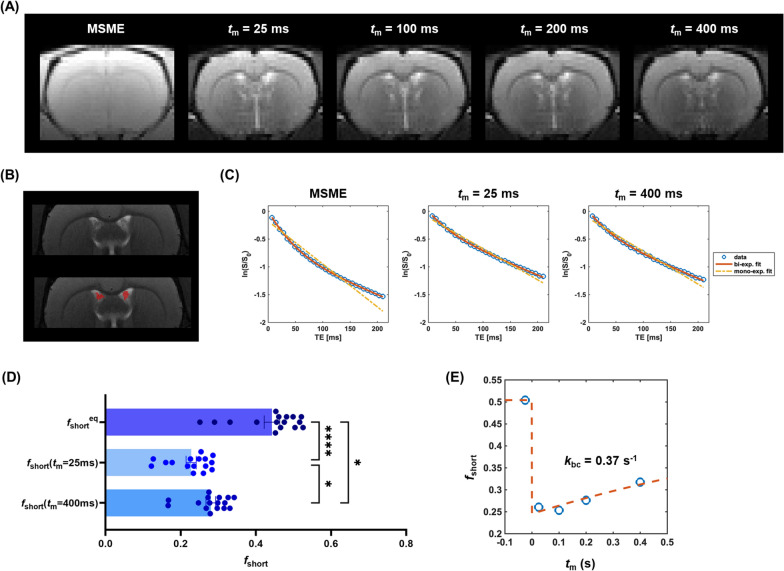
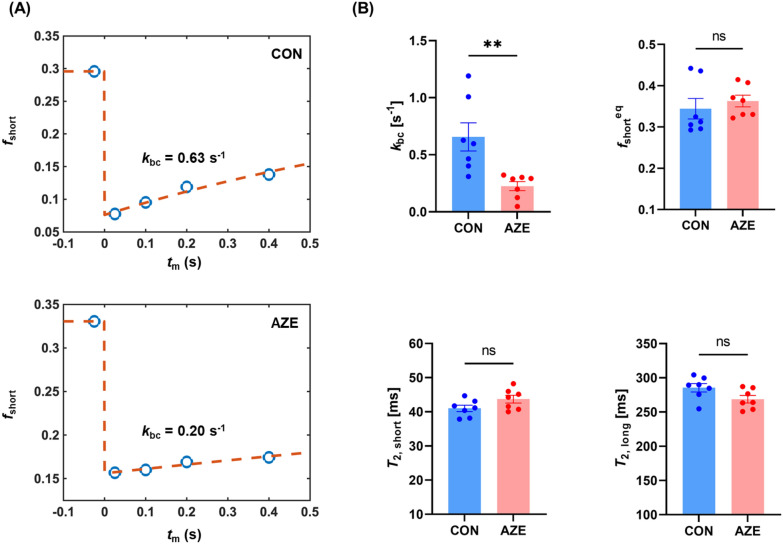
Results: REXI pulse sequence successfully captured changes in the proton exchange rate (from short-T2 component to long-T2 component [i.e., ksl]) of urea-water phantoms at varying pH, demonstrating its sensitivity to exchange processes. In rat CP, REXI significantly suppressed the CP tissue signal, reducing the short-T2 fraction (fshort) from 0.44 to 0.23 (p < 0.0001), with significant recovery to 0.28 after a mixing time of 400 ms (p = 0.014). The changes in fshort at various mixing times can be accurately described by a two-site exchange model, yielding a steady-state water efflux rate from CP to CSF (i.e., kbc) of 0.49 s-1. A scan-rescan experiment demonstrated that REXI had excellent reproducibility in measuring kbc (intraclass correlation coefficient = 0.90). Notably, acetazolamide-induced CSF reduction resulted in a 66% decrease in kbc within rat CP.
Conclusions: This proof-of-concept study demonstrates the feasibility of REXI for measuring trans-barrier water exchange in the CP, offering a promising biomarker for future assessments of CP function.
Keywords: Blood cerebrospinal fluid barrier; Choroid plexus; Contrast-agent-free; Magnetic resonance imaging; Relaxation exchange.
© 2024. The Author(s).
Conflict of interest statement
Declarations. Ethics approval and consent to participate: Animal experiments were approved by the Animal Experimentation Committee of Zhejiang University. Consent for publication: Not applicable. Competing interests: The authors declare no competing interests.
Figures


Similar articles
-
Feasibility of relaxation-exchange magnetic resonance imaging (REXI) for measuring water exchange across the blood-CSF barrier in the human choroid plexus.J Cereb Blood Flow Metab. 2025 Aug 20:271678X251369218. doi: 10.1177/0271678X251369218. Online ahead of print. J Cereb Blood Flow Metab. 2025. PMID: 40832972
-
Ultra-long-TE arterial spin labeling reveals rapid and brain-wide blood-to-CSF water transport in humans.Neuroimage. 2021 Dec 15;245:118755. doi: 10.1016/j.neuroimage.2021.118755. Epub 2021 Nov 24. Neuroimage. 2021. PMID: 34826596 Free PMC article.
-
Acetazolamide lowers intracranial pressure and modulates the cerebrospinal fluid secretion pathway in healthy rats.Neurosci Lett. 2017 Apr 3;645:33-39. doi: 10.1016/j.neulet.2017.02.032. Epub 2017 Feb 20. Neurosci Lett. 2017. PMID: 28219789
-
A balanced view of choroid plexus structure and function: Focus on adult humans.Exp Neurol. 2015 May;267:78-86. doi: 10.1016/j.expneurol.2015.02.032. Epub 2015 Mar 4. Exp Neurol. 2015. PMID: 25747036 Review.
-
The choroid plexus-cerebrospinal fluid system: from development to aging.Curr Top Dev Biol. 2005;71:1-52. doi: 10.1016/S0070-2153(05)71001-2. Curr Top Dev Biol. 2005. PMID: 16344101 Review.
References
MeSH terms
Substances
Grants and funding
LinkOut - more resources
Full Text Sources
Medical
Miscellaneous
