. 2024 Nov 26;16(1):138.
doi: 10.1186/s13073-024-01410-8.

Integrated analyses of multi-omic data derived from paired primary lung cancer and brain metastasis reveal the metabolic vulnerability as a novel therapeutic target

Affiliations

Integrated analyses of multi-omic data derived from paired primary lung cancer and brain metastasis reveal the metabolic vulnerability as a novel therapeutic target

Hao Duan et al. Genome Med. .

Abstract

Background: Lung cancer brain metastases (LC-BrMs) are frequently associated with dismal mortality rates in patients with lung cancer; however, standard of care therapies for LC-BrMs are still limited in their efficacy. A deep understanding of molecular mechanisms and tumor microenvironment of LC-BrMs will provide us with new insights into developing novel therapeutics for treating patients with LC-BrMs.

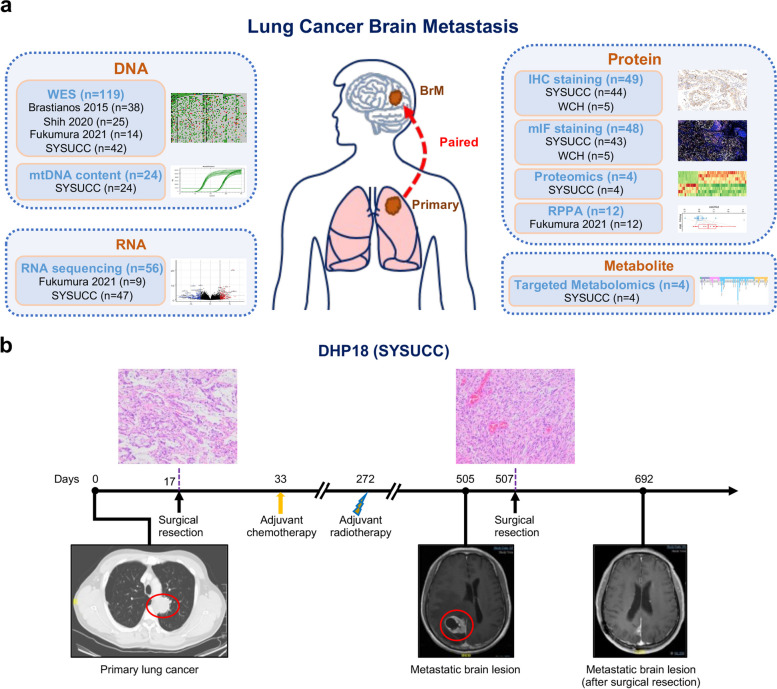
Methods: Here, we performed integrated analyses of genomic, transcriptomic, proteomic, metabolomic, and single-cell RNA sequencing data which were derived from a total number of 154 patients with paired and unpaired primary lung cancer and LC-BrM, spanning four published and two newly generated patient cohorts on both bulk and single cell levels.

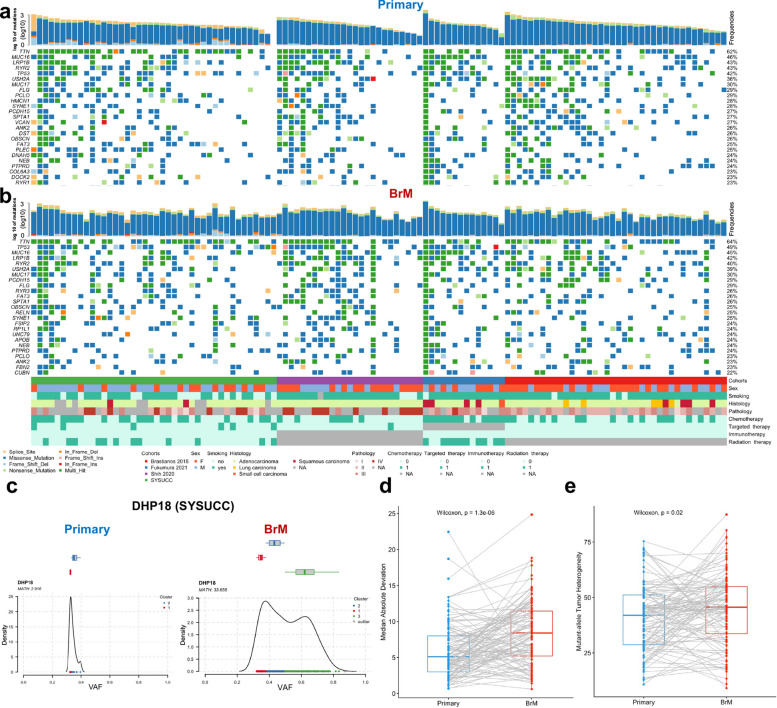
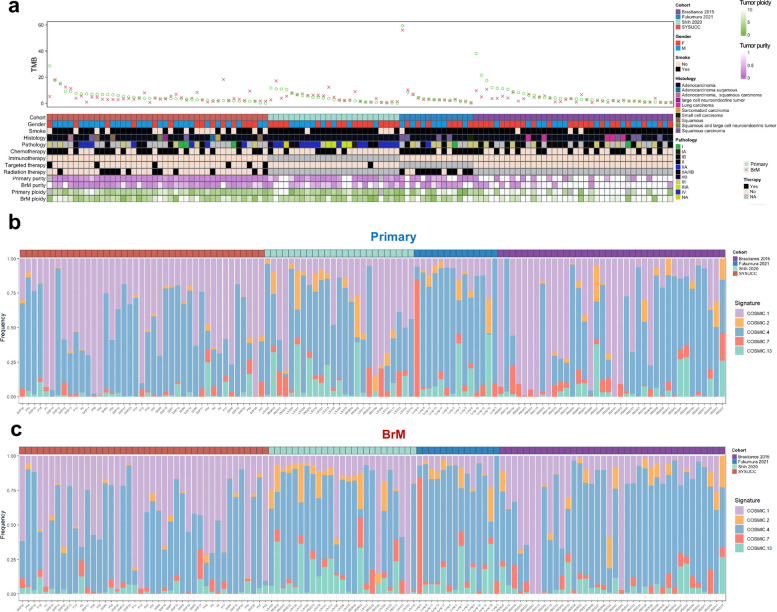
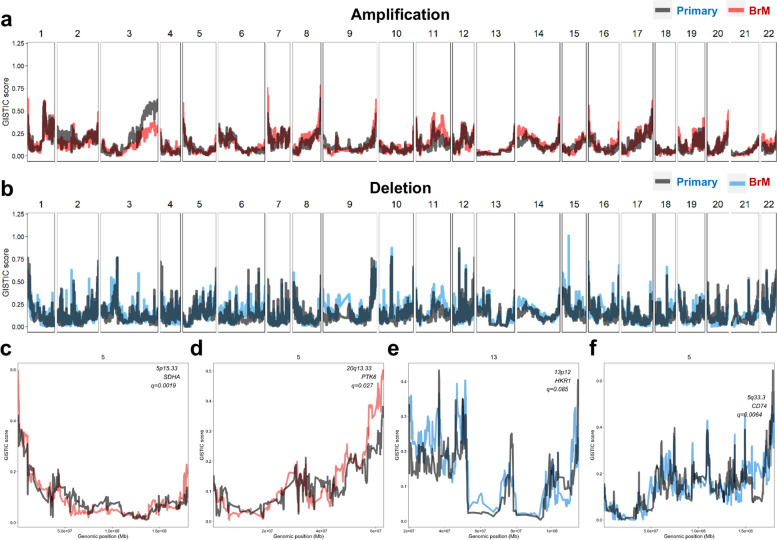
Results: We uncovered that LC-BrMs exhibited a significantly greater intra-tumor heterogeneity. We also observed that mutations in a subset of genes were almost always shared by both primary lung cancers and LC-BrM lesions, including TTN, TP53, MUC16, LRP1B, RYR2, and EGFR. In addition, the genome-wide landscape of somatic copy number alterations was similar between primary lung cancers and LC-BrM lesions. Nevertheless, several regions of focal amplification were significantly enriched in LC-BrMs, including 5p15.33 and 20q13.33. Intriguingly, integrated analyses of transcriptomic, proteomic, and metabolomic data revealed mitochondrial-specific metabolism was activated but tumor immune microenvironment was suppressed in LC-BrMs. Subsequently, we validated our results by conducting real-time quantitative reverse transcription PCR experiments, immunohistochemistry, and multiplexed immunofluorescence staining of patients' paired tumor specimens. Therapeutically, targeting oxidative phosphorylation with gamitrinib in patient-derived organoids of LC-BrMs induced apoptosis and inhibited cell proliferation. The combination of gamitrinib plus anti-PD-1 immunotherapy significantly improved survival of mice bearing LC-BrMs. Patients with a higher expression of mitochondrial metabolism genes but a lower expression of immune genes in their LC-BrM lesions tended to have a worse survival outcome.

Conclusions: In conclusion, our findings not only provide comprehensive and integrated perspectives of molecular underpinnings of LC-BrMs but also contribute to the development of a potential, rationale-based combinatorial therapeutic strategy with the goal of translating it into clinical trials for patients with LC-BrMs.

Keywords: Lung cancer brain metastases (LC-BrMs); Mitochondrial-specific metabolism; Tumor immune microenvironment.


Conflict of interest statement

Declarations. Ethics approval and consent to participate: The lung tumor, brain metastasis tissues, and blood samples were derived from patients who were presented at SYSUCC (n = 67) and WCH (n = 5). Patient samples were collected under the Institutional Review Board (IRB) protocols of SYSUCC (Protocol B2021-256–01) and WCH (2019–57), approved by the Medical Ethics Committee of SYSUCC and the Biomedical Ethics Committee of WCH (Sichuan University), respectively. Written informed consent were obtained from all patients. This study was conducted in accordance with the principles of the Helsinki Declaration. Animal. This study, which involved animal models, was approved by the Animal Care and Use Committee of Laboratory Animal Ethics Committee of Affiliated First Hospital of Guangzhou Medical University (Reference No. 2021169), in full compliance with all applicable ethical standards for animal research. Consent for publication: Not applicable. Competing interests: The authors declare no competing interests.

Figures

Fig. 1
Fig. 1
Study workflow, overview of patients and samples, and cohort characteristics. a Overview of patient cohorts and various experimental platforms. b A representative patient with primary lung cancer (DHP18) who later developed brain metastasis. A primary lung lesion was detected by CT scan and surgical resection was performed to obtain the primary lung cancer sample. However, 1 year after the surgery, a new brain metastasis lesion was identified through MRI scan. The surgical resection was then performed to remove the brain metastatic lesion
Fig. 2
Fig. 2
Oncoplots showing the 25 most frequently mutated genes in paired primary lung cancer and brain metastasis (BrM) specimens. a, b Recurrently mutated oncogenic driver genes identified by Mutect2 in primary lung cancers (a) and BrMs (b). Every column represented a single patient stratified by cohort and ordered from left to right by the number of oncogenic driver genes identified in BrM samples. The variant type was depicted by its color. c Cluster plots of the primary lung cancer (left) and BrM sample (right) derived from the representative patient DHP18. X-axis represented variant allele frequency, the top bar shows the number of clusters on top of each plot, and the math number was noted in the upper left corner. d, e The box plot of median absolute deviation and mutant-allele tumor heterogeneity in paired primary lung cancers and brain metastasis lesions. The p-value was determined using pairwise two-sided Wilcoxon test
Fig. 3
Fig. 3
Tumor mutational burden and mutational signatures. a Integrated analyses of four independent cohorts (n = 119 patients) depicting TMB in each pair of primary lung cancer and brain metastasis (BrM) specimens according to cohorts, gender, smoking history, histological group, pathological level, different therapies, purity, and ploidy. Each column represents a single patient with two tumor specimens scattered at two separate spaces. All tumor specimens were grouped by cohorts and ordered from left to right by decreasing mutation frequencies of BrMs. Green circle indicated primary lung cancer and the red fork indicated BrM. b Percentage of mutational signature contribution in each primary lung cancer specimen. c Percentage of mutational signature contribution in each BrM specimen
Fig. 4
Fig. 4
The landscape of somatic copy-number alteration in paired primary lung cancer and brain metastasis (BrM) specimens. a, b GISTIC amplification (a) and deletion (b) plots of primary lung cancer (n = 119) and BrM (n = 119) samples. In the top figure, red line is the amplification in BrM, and gray line is amplification in primary; in the both figures, blue line is the deletion in BrM, and gray line is deletion in primary. c–f. Four representative GISTIC plots showing regions of candidate driver genes of BrM compared to primary lung cancer
Fig. 5
Fig. 5
Oxidative phosphorylation was enriched in lung cancer brain metastases (LC-BrMs). a The volcano plot of differentially expressed genes between primary lung cancer and LC-BrMs in two cohorts of 56 patients. b Gene Set Enrichment Analysis (GSEA) plots of 5 mitochondrial pathways. The peak point of the top part in each plot represented the enrichment score (ES), whereas the bottom part showed where the rest of genes related to the pathway were located according to the ranking. c, d The tSNE plot (c) and box plot (d) of enrichment score of the citric acid TCA cycle pathway in single epithelial cells of primary lung cancer and brain metastasis. Each dot represented an individual patient in panel d. The p-value was determined using pairwise two-sided Student’s t test. e The box plot of relative mitochondrial DNA (mtDNA) content in paired primary lung cancers and brain metastasis lesions. The p-value was determined using pairwise two-sided Student’s t test. f The volcano plot of differentially expressed proteins between primary lung cancer and LC-BrMs. g GSEA plot of 4 mitochondrial pathways. The peak point of the top part in each plot represented the ES, whereas the bottom part showed where the rest of proteins related to the pathway were located according to the ranking. h H&E and immunohistochemistry (IHC) staining of MTCO1, UQCRC2, and COXIV in a representative patient (DHP18) with paired primary lung cancer and LC-BrM lesions. i The volcano plot of differentially expressed metabolites between primary lung cancer and LC-BrMs. j Box plots for pathway analysis of differentially expressed metabolites between primary lung cancer and LC-BrMs
Fig. 6
Fig. 6
Brain metastasis (BrM) lesions presented an immunosuppressive tumor microenvironment. a Gene Set Enrichment Analysis (GSEA) plots of 5 immune-related signaling pathways based on RNA sequencing data. The peak point of the top park in each plot represented the enrichment score (ES), whereas the bottom part showed where the rest of genes of each pathway were located according to the ranking. b, c Box plot representation of normalized MCP counter scores (b) and ESTIMATE scores (c) for paired primary lung cancers and BrMs. The p-value was determined by the pairwise t-test. d Protein set enriched analysis of 4 immune related signaling pathways based on proteomics data. The peak point of the top park in each plot represented the ES, whereas the bottom part showed where the rest of proteins of each pathway were located according to the ranking. e Representative multiplex immunofluorescence (mIF) staining of paired primary lung cancer and BrM lesions from the patient DHP18. mIF markers include DAPI (blue), CD3 (orange), CD68 (green), Ki-67 (red), pan-cytokeratin (white), PD-1 (Cyan), and PD-L1 (yellow). Scale = 50 μm. f, g Box plot representation of the count number of CD3+ (f) and CD68+ (g) cells per mm2 in paired primary lung cancer and BrM lesions (n = 50 patients). The p-value was determined by the pairwise two-sided Student’s t test (*, p < 0.05; **, p < 0.01; ***, p < 0.001; ****, p < 0.0001)
Fig. 7
Fig. 7
Gamitrinib exhibits its anti-tumor activity by inhibiting oxidative phosphorylation (OXPHOS) in patient-derived organoids (PDOs) of lung cancer brain metastasis (LC-BrM). a Sankey plot indicating the transcriptional subtype switch from paired primary lung cancers to brain metastasis lesions. b The heatmap showing the enrichment of 5 mitochondrial pathways and 5 immune pathways in LC-BrM lesions with RNA sequencing data. c Kaplan–Meier survival plot of patients with LC-BrM lesions who were stratified into low and high subgroups based on single sample gene set enrichment analysis (ssGSEA) scores of mitochondrial pathways and immune pathways. The median ssGSEA score was used to define low and high subgroups. The p-value was computed by a two-sided log-rank test. d–f Microscopic images of bright-field and immunofluorescence staining of PDO1072 (d), PDO1269 (e), and PDO1466 (f) PDOs which were treated with DMSO or gamitrinib. g Relative mRNA expression of OXPHOS genes in two BrM PDOs (PDO0685 and PDO0750) treated with DMSO or gamitrinib. h The volcano plot of differential metabolite analysis of LC-BrMs PDOs treated with DMSO or gamitrinib. i Box plots for pathway analysis of differentially expressed metabolites of LC-BrMs treated with DMSO or gamitrinib
Fig. 8
Fig. 8
The combination therapy of an oxidative phosphorylation (OXPHOS) inhibitor plus anti-PD-1 blockade improved survival of mice with lung cancer brain metastases (LC-BrMs). a Schematic illustration of the establishment of murine BrMs of Lewis lung cancer cells and treatment design. b Kaplan–Meier survival plot of mice with LC-BrMs treated with control, gamitrinib at 10 mg/kg, anti-PD-1 10 mg/kg, and gamitrinib 10 mg/kg plus anti-PD-1 10 mg/kg. The p-value is computed using a two-sided log-rank test. c Representative images of H&E staining and immunohistochemistry (IHC) staining with anti-Ki-67, anti-CD3, anti-CD4, anti-CD8, and anti-PD-L1 for tumors in each treatment group. Scale = 50 μm. d Schematic diagram of the current study and potential therapeutic implications

References

    1. Sung H, Ferlay J, Siegel RL, Laversanne M, Soerjomataram I, Jemal A, Bray F. Global Cancer Statistics 2020: GLOBOCAN Estimates of Incidence and Mortality Worldwide for 36 Cancers in 185 Countries. CA Cancer J Clin. 2021;71:209–49. 10.3322/caac.21660. - PubMed
    1. Riihimaki M, Hemminki A, Fallah M, Thomsen H, Sundquist K, Sundquist J, Hemminki K. Metastatic sites and survival in lung cancer. Lung Cancer. 2014;86:78–84. 10.1016/j.lungcan.2014.07.020. - PubMed
    1. Siegel RL, Miller KD, Jemal A. Cancer statistics, 2018. CA Cancer J Clin. 2018;68:7–30. 10.3322/caac.21442. - PubMed
    1. Siegel RL, Miller KD, Jemal A. Cancer Statistics, 2017. CA Cancer J Clin. 2017;67:7–30. 10.3322/caac.21387. - PubMed
    1. Yang JC, Wu YL, Schuler M, Sebastian M, Popat S, Yamamoto N, Zhou C, Hu CP, O’Byrne K, Feng J, et al. Afatinib versus cisplatin-based chemotherapy for EGFR mutation-positive lung adenocarcinoma (LUX-Lung 3 and LUX-Lung 6): analysis of overall survival data from two randomised, phase 3 trials. Lancet Oncol. 2015;16:141–51. 10.1016/S1470-2045(14)71173-8. - PubMed

MeSH terms

Substances