. 2024 Oct 31;26(11):932.
doi: 10.3390/e26110932.

Visibility Graph Investigation of the Shallow Seismicity of Lai Chau Area (Vietnam)

Affiliations

Visibility Graph Investigation of the Shallow Seismicity of Lai Chau Area (Vietnam)

Luciano Telesca et al. Entropy (Basel). .

Abstract

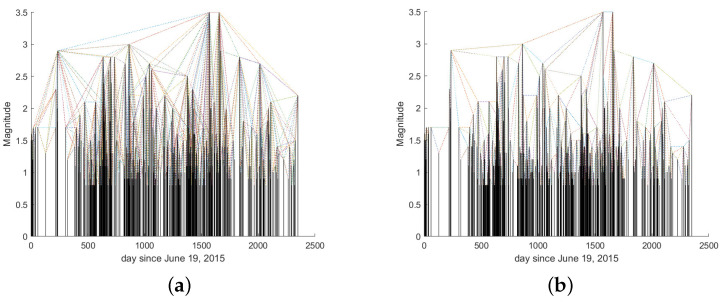
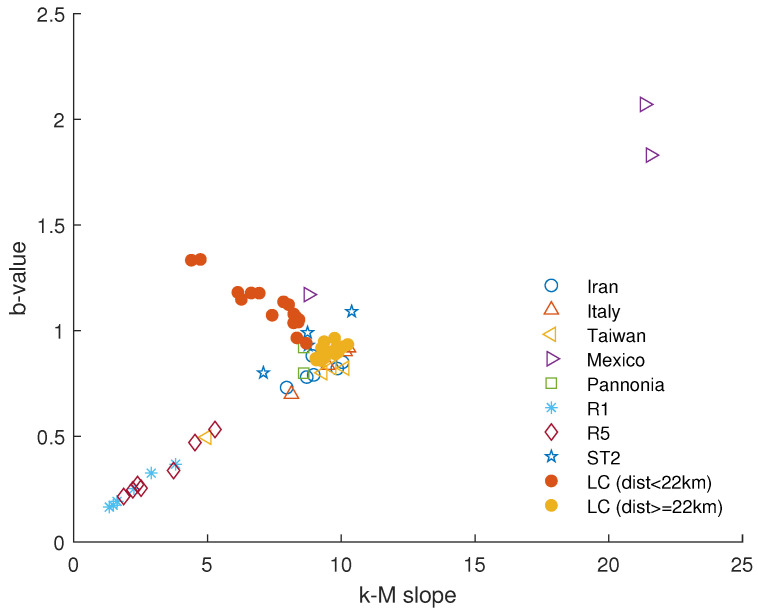
In this study, the topological properties of the shallow seismicity occurring in the area around the Lai Chau hydropower plant (Vietnam) are investigated by using visibility graph (VG) analysis, a well-known method to convert time series into networks or graphs. The relationship between the seismicity and reservoir water level was analyzed using Interlayer Mutual Information (IMI) and the Frobenius norm, both applied to the corresponding VG networks. IMI was used to assess the correlation between the two variables, while the Frobenius norm was employed to estimate the time delay between them. The total seismicity, which resulted in an M≥0.8 with a b-value of 0.86, is characterized by a k-M slope of ≈9.1. Analyzing the variation of the seismological and topological parameters of the seismicity relative to the distance from the center of the Lai Chau reservoir revealed the following features: (1) the b-value fluctuates around a mean value of 1.21 at distances of up to 10-11 km, while, for distances larger than 25-30 km, it tends to the value of 0.86; (2) the maximum IMI between the monthly number of earthquakes and the monthly mean water level occurs at a distance of 9-11 km, showing a distance evolution similar to that of the b-value; (3) at these distances from the center of the reservoir, the time lag between the earthquake monthly counts and the monthly water level mean is 9-10 months; (4) the relationship between the b-value and the k-M slope suggests that the k-M slope depends on the number of earthquakes within a 22 km radius from the center of the dam. Our study's findings offer new insights into the complex dynamics of seismicity occurring around reservoirs.

Keywords: fractal; reservoir-triggered seismicity; spectral; time clustering.


Conflict of interest statement

The authors declare no conflicts of interest.

Figures

Figure 1
Figure 1
Spatial distribution of earthquake epicenters during the period of September 2014 to June 2021 (dark circles). Lai Chau reservoir is in light blue. The blue and red building symbols indicate the local seismic stations and national seismic stations, respectively. Geology and identified geologically mapped faults (red) with dip and slip direction as given by [18]. (Modified from [22]).
Figure 2
Figure 2
(a) Earthquake sequence and the links among the magnitudes defined by the VG. (b) Graph of the links among the nodes defined by the VG.
Figure 3
Figure 3
Comparison between two sinusoids, y(t)=sin2πt10 (blue) and yd(t)=sin2π(t3)10 (red), both with period T=10 and the second one delayed by d=3.
Figure 4
Figure 4
Froebenius norm AyAyd2 between the two sinusoids plotted in Figure 3.
Figure 5
Figure 5
Frequency–magnitude distribution of earthquakes occurring at depths of up to 10 km and within a 40 km radius from the center of the dam.
Figure 6
Figure 6
Sequence of earthquakes occurring within 40 km of the center of Lai Chau reservoir. The links among the magnitudes are defined by the NVG (a) and HVG (b).
Figure 7
Figure 7
Sequences of degree k for the NVG and HVG applied to the seismic dataset shown in Figure 6.
Figure 8
Figure 8
k-M relationship between the degree and the magnitude for the whole seismic dataset. The slope of the regression line is 9.07.
Figure 9
Figure 9
Distribution of the k-M slope for the randomized earthquake sequences. The vertical line indicates the k-M slope of the original sequence.
Figure 10
Figure 10
Monthly earthquake counts (red) and mean water level (blue) during the investigation period.
Figure 11
Figure 11
Number of earthquakes in the complete seismic catalog (a,b) showing completeness magnitude versus distance from the center of the reservoir.
Figure 12
Figure 12
Variation of the b-value with the distance from the center of the dam (blue). The red horizontal line represents the b-value calculated for the tectonic seismicity observed prior to the reservoir impoundment, corresponding to a completeness magnitude of 0.7, as indicated in [34]. The error on b is indicated by the vertical bars, while the red dotted horizontal lines delimit the error band on b calculated in [34].
Figure 13
Figure 13
IMI between monthly number of earthquakes and monthly mean water level calculated by NVG (red) and HVG (blue).
Figure 14
Figure 14
Variation with the time lag τ of the Frobenius norm of the difference between the adjacency matrix of the monthly number of earthquakes and that of the τ-shifted monthly mean of water calculated by using the NVG (a) and the HVG (b).
Figure 15
Figure 15
Variation of the kM slope with the distance from the center of the dam.
Figure 16
Figure 16
Relationship between the k-M slope and the b-value for the Lai Chau dataset (for distances from the dam center less than, larger than, or equal to 22 km) compared with that of the seismic datasets analyzed in previous studies (Iran [12], Italy and Taiwan [33], Mexico [11], Pannonia [38], R1 and R2 [39], and ST2 [37]).
Figure 17
Figure 17
Relationship between the kM slope and the b-value for the seismic datasets extracted at distances from the center varying from 6 to 40 km. The vertical black line separates the values relative to distances less than, greater than, or equal to 22 km from the center of the dam.
Figure 18
Figure 18
Relationship between the kM slope and the number of events for the seismic datasets extracted at distances from the center varying from 6 to 40 km. The vertical black line separates the values relative to distances less than, greater than, or equal to 22 km from the center of the dam.
Figure 19
Figure 19
Variation of the ratio between kM slope and the b-value with catalog size for Lai Chau dataset (red circles) compared with the relationship proposed in [15] (blue filled circles).

References

    1. Zhang R., Ashuri B., Shyr Y., Deng Y. Forecasting construction cost index based on visibility graph: A network approach. Phys. A Stat. Mech. Its Appl. 2018;493:239–252. doi: 10.1016/j.physa.2017.10.052. - DOI
    1. Long Y. Visibility graph network analysis of gold price time series. Phys. A Stat. Mech. Its Appl. 2013;392:3374–3384. doi: 10.1016/j.physa.2013.03.063. - DOI
    1. Wang N., Li D., Wang Q. Visibility graph analysis on quarterly macroeconomic series of China based on complex network theory. Phys. A Stat. Mech. Its Appl. 2012;391:6543–6555. doi: 10.1016/j.physa.2012.07.054. - DOI
    1. Qian M.C., Jiang Z.Q., Zhou W.X. Universal and nonuniversal allometric scaling behaviors in the visibility graphs of world stock market indices. J. Phys. A Math. Theor. 2010;43:335002. doi: 10.1088/1751-8113/43/33/335002. - DOI
    1. Jiang W., Wei B., Zhan J., Xie C., Zhou D. A visibility graph power averaging aggregation operator: A methodology based on network analysis. Comput. Ind. Eng. 2016;101:260–268. doi: 10.1016/j.cie.2016.09.009. - DOI

LinkOut - more resources