. 2024 Nov 1;13(11):1340.
doi: 10.3390/antiox13111340.

Characterization of the Peroxisomal Proteome and Redox Balance in Human Prostate Cancer Cell Lines

Affiliations

Characterization of the Peroxisomal Proteome and Redox Balance in Human Prostate Cancer Cell Lines

Mohamed A F Hussein et al. Antioxidants (Basel). .

Abstract

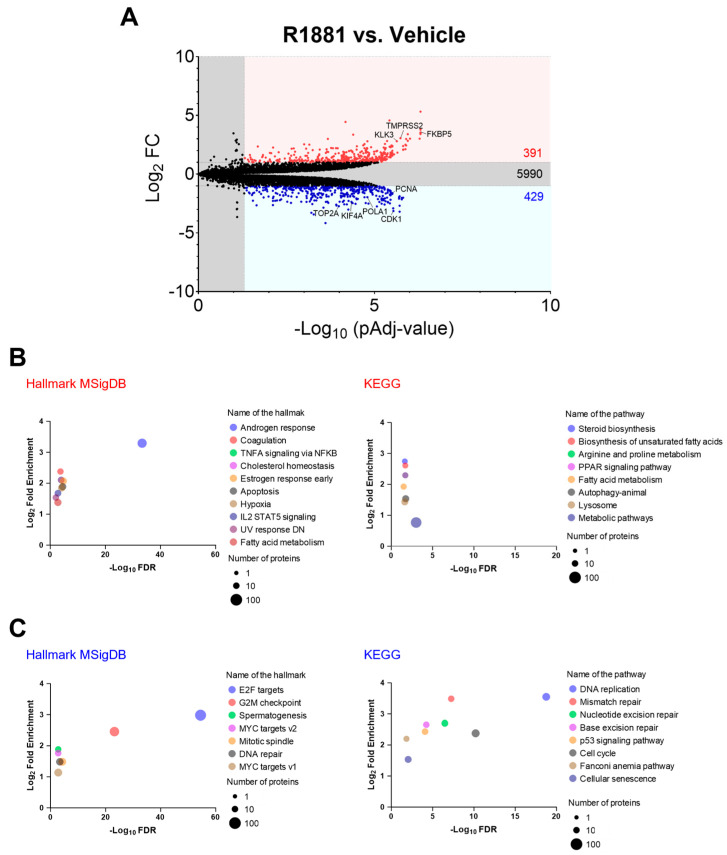
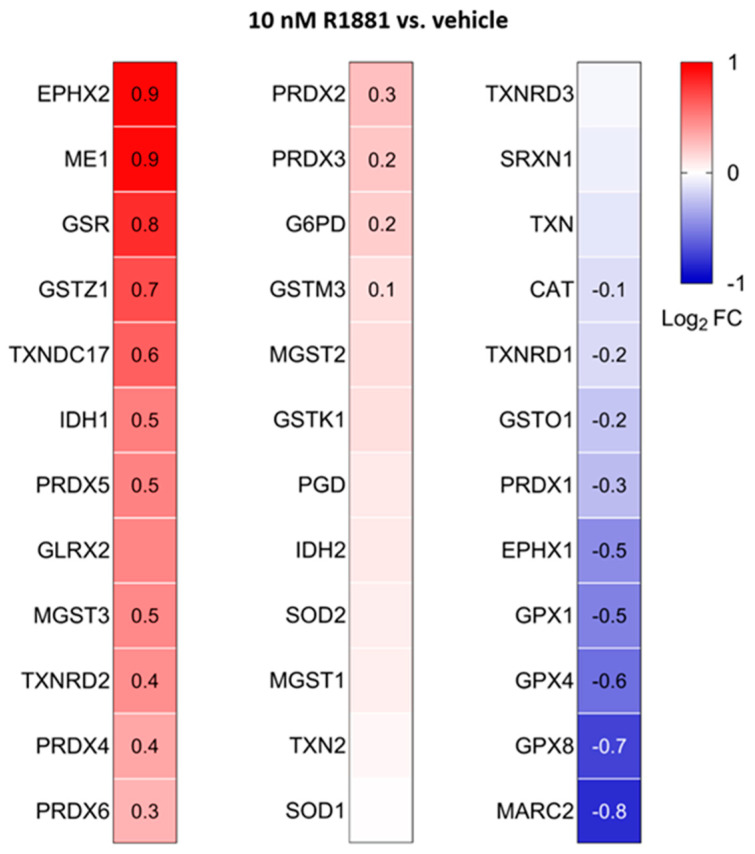
Prostate cancer (PCa) is associated with disruptions in cellular redox balance. Given the intricate role of peroxisomes in redox metabolism, we conducted comprehensive proteomics analyses to compare peroxisomal and redox protein profiles between benign (RWPE-1) and malignant (22Rv1, LNCaP, and PC3) prostate cell lines. Our analyses revealed significant enrichment of the "peroxisome" pathway among proteins notably upregulated in androgen receptor (AR)-positive cell lines. In addition, catalase (CAT) activity was consistently higher in these malignant cell lines compared to RWPE-1, which contrasts with previous studies reporting lower CAT levels and increased H2O2 levels in PCa tissues compared to adjacent normal tissues. To mimic this clinical scenario, we used RNA interference to knock down CAT expression. Our results show that reduced CAT levels enhanced 22Rv1 and LNCaP cell proliferation. R1881-induced activation of AR, a key driver of PCa, increased expression of the H2O2-producing peroxisomal β-oxidation enzymes acyl-coenzyme A oxidase 1 and 3, reduced CAT expression and activity, and elevated peroxisomal H2O2 levels. Considering these changes and other antioxidant enzyme profile alterations, we propose that enhanced AR activity in PCa reduces CAT function, leading to increased peroxisomal H2O2 levels that trigger adaptive stress responses to promote cell survival, growth, and proliferation.

Keywords: R1881; androgen receptor; catalase; hydrogen peroxide; peroxisomes; prostate cancer.


Conflict of interest statement

The authors declare no conflicts of interest. The funders had no role in the design of this study; in the collection, analyses, or interpretation of data; in the writing of the manuscript; or in the decision to publish the results.

Figures

Figure 1
Figure 1
Comparison of the subcellular glutathione redox state and H2O2 levels between non-malignant and malignant prostate cell lines. RWPE1, 22Rv1, LNCaP, and PC3 cells were transfected with a plasmid encoding a peroxisomal (po-), cytosolic (c-), or mitochondrial (mt-) variant of (A) the glutathione redox sensor roGFP2, or (B) the H2O2 sensor roGFP2-Orp1. Cells were cultured in regular minimum essential medium (MEM), or for RWPE-1, also in keratinocyte serum-free medium (KSFM). One and two days later, the F400/F480 response ratios of roGFP2 and roGFP2-Orp1 were measured and presented as box plots. Each box plot shows the interquartile range, with the bottom and top edges representing the 25th and 75th percentiles, respectively. The line inside the box indicates the median, and the lines extending from the box represent one standard deviation below and above the mean. Data are derived from three independent experiments, each represented by a different color. Statistical comparisons were carried out against the RWPE-1/MEM condition using a nested one-way ANOVA (ns, p ≥ 0.05; *, p < 0.05; **, p < 0.01). AU, arbitrary units.
Figure 2
Figure 2
Principal component analysis of proteomics data from four prostate cell lines. The plot was generated by FragPipe-Analyst using protein abundance data from one benign (RWPE-1) and three malignant prostate cell lines, including two androgen-responsive (LNCaP and 22Rv1) and one androgen-resistant (PC3) cell line. The cells were cultured in regular MEM (not indicated) or, in the case of RWPE-1, also in KSFM. The results of three biological replicates are plotted. The x-and y-axes provide the percent variance explained by each principal component (PC).
Figure 3
Figure 3
KEGG enrichment analysis of differentially expressed proteins across four prostate cell lines. (A) Volcano plots depicting the differences in protein abundance among cell lines. Proteins significantly upregulated (FC ≥ 2) or downregulated (FC ≤ 0.5) (pAdj < 0.05) are represented by a red or blue dot, respectively (n = 3 biological replicates). Black dots represent proteins that do not show statistically significant differences in expression. The numbers in the panels indicate the total number of proteins within each group. The list of differentially expressed proteins was generated by FragPipe-Analyst. The Benjamini–Hochberg method was used to correct for false discovery rates. (B,C) KEGG analyses of the differentially expressed proteins using ShinyGO 0.80 with the following settings: selected species, human; false discovery rate (FDR) cut-off, 0.05; sort by FDR; the total list of identified proteins was uploaded as “background”. The top KEGG pathways with significant enrichment (up to 10) are shown for proteins with (B) increased and (C) decreased expression. Pathways are sorted by fold enrichment. The size of the circles indicates the number of proteins identified in each KEGG pathway, with larger circles representing higher numbers. In panel (B), the circles for “Peroxisome” and “Purine metabolism” overlap in the 22Rv1 vs. RWPE-1 plot. ASNSM, amino sugar and nucleotide sugar metabolism; 2OA, 2-oxocarboxylic acid; AP, arginine/proline; BNS, biosynthesis of nucleotide sugars; CCC, complement and coagulation cascades; CC, chemical carcinogenesis; CCRI, cytokine-cytokine receptor interaction; CSP, chemokine signaling pathway; ECM, extracellular matrix; GSL, glycosphingolipid; GAG, glycosaminoglycan; GD, glyoxylate and dicarboxylate; GST, glycine/serine/threonine; HCL, hematopoietic cell lineage; HPV, human papillomavirus; LTM, leukocyte transendothelial migration; PGI, pentose and glucuronate interconversions; PHSSA, parathyroid hormone synthesis secretion and action; PPAR, peroxisome proliferator-activated receptor; SLE, systemic lupus erythematosus; VLI, valine/leucine/isoleucine.
Figure 4
Figure 4
Heatmaps showing the proteome profile of 76 peroxisome-associated proteins across three distinct malignant prostate cell lines relative to RWPE-1. The relative protein abundances, expressed as Log2 fold change (FC), are depicted by a false color scale where red indicates upregulation, white symbolizes equal expression, and blue denotes downregulation compared to RWPE-1 cells cultured in regular MEM. Each box represents the average of three biological replicates, with Log2 FC displayed only if the adjusted p-value is <0.05. ND, protein not detected. Met, metabolism; PMP, peroxisomal membrane protein; PTS, peroxisomal targeting sequence; PO, peroxisome.
Figure 5
Figure 5
Heatmaps depicting the proteome profile of 38 primary and secondary antioxidant enzymes in three malignant prostate cell lines relative to RWPE-1. The relative protein abundances, expressed as Log2 FC, are depicted by a false color scale where red indicates upregulation, white symbolizes equal expression, and blue denotes downregulation compared to RWPE-1 cells cultured in regular MEM. Each box represents the average of three biological replicates, with Log2 FC displayed only if the adjusted p-value is < 0.05. ND, protein not detected.
Figure 6
Figure 6
Validation of the catalase mass spectrometry data through immunoblotting and activity measurements. The relative abundance of catalase (CAT) among different cell lines was determined by (A) mass spectrometry and (B) immunoblotting. A representative blot is shown, with relevant molecular mass markers displayed on the right. Glyceraldehyde-3-phosphate dehydrogenase (GAPDH) was used as a loading control. The values are normalized to those in the RWPE-1/MEM condition, which was assigned a baseline value of 1. (C) CAT activity in lysates from the different cell lines. All values represent the mean ± standard deviation of 3 or 4 biological replicates. **, p < 0.01; ****, p < 0.0001; ns, non-significant.
Figure 7
Figure 7
The catalase inhibitor 3-amino-1,2,4-triazole suppresses the growth of RWPE1/KSFM and LNCaP/MEM cells. (A) In all cell lines, 3-amino-1,2,4-triazole (3-AT) effectively inhibits CAT activity. Cells were treated with 10 mM 3-AT, and CAT activity was measured after two days in both control and 3-AT-treated conditions (n = 4). (B) Proliferation profiles of cells treated or not with 10 mM 3-AT. Data represent the mean relative confluence percentage compared to the starting point (n = 3). Error bars represent standard deviation. Statistical analysis was performed using the unpaired T-test (*, p < 0.05; **, p < 0.01; ***, p < 0.001; ****, p < 0.0001).
Figure 8
Figure 8
Downregulation of catalase expression promotes LNCaP and 22Rv1 cell proliferation. (A) Proliferation profiles of cells treated with DsiRNAs. Each dot represents the mean FC in confluence (relative to the starting point) from at least four independent biological replicates. Error bars indicate standard deviation. Statistical analysis was assessed at each time point using one-way ANOVA followed by a Dunnett’s test to compare DsiCAT1 and DsiCAT2 with DsiNC (*, p < 0.05; **, p < 0.01; ***, p < 0.001; ****, p < 0.0001). (B) Validation of the DsiCAT1 and DsiCAT2 siRNAs. Ponceau S staining was used to confirm equal protein loading.
Figure 9
Figure 9
Treatment of LNCaP cells with 10 nM R1881 modulates the peroxisomal glutathione redox state and H2O2 levels. LNCaP cells were cultured in phenol red-free MEM supplemented with 10% charcoal-stripped serum for 4 days. Subsequently, they were treated with either the ethanol vehicle (−) or 1 pM or 10 nM R1881 (+). After one day, the cells were transfected with a plasmid encoding a peroxisomal (PO), cytosolic (C), or mitochondrial (MT) variant of (A) the glutathione redox sensor roGFP2, or (B) the H2O2 sensor roGFP2-Orp1 (representative images of the subcellular distribution patterns of the fluorescent reporter proteins are shown in Figure S8). Subsequently, the medium was replaced with fresh ethanol- or R1881-containing medium. Two days later, the F400/F480 response ratios of the sensors were measured, expressed as the percentage of the average vehicle response, and presented as box plots. Each box represents the interquartile range, with the bottom and top showing the 25th and 75th percentiles, respectively. The line inside the box indicates the median and the lines extending from the box representing one standard deviation below and above the mean. Data from each independent experiment (n = 3) are indicated by a different color. Statistical comparisons were performed using nested T-tests (ns, non-significant; *, p < 0.05; **, p < 0.01; ****, p < 0.0001). AU, arbitrary units.
Figure 10
Figure 10
Gene-set enrichment analysis of differentially expressed proteins in LNCaP cells treated with the AR agonist R1881 compared to the vehicle. LNCaP cells were cultured in phenol red-free MEM supplemented with 10% charcoal-stripped serum for 4 days, followed by treatment with either ethanol (vehicle) or 10 nM R1881. After one day, the medium was replaced with fresh ethanol- or R1881-containing medium. Two days later, cells were harvested and processed for proteomics analysis. (A) Volcano plots showing the differences in protein abundance between 10 nM R1881-treated and vehicle-treated LNCaP cells. Proteins significantly up- or downregulated (FC ≥ 2; pAdj < 0.05) are indicated by red or blue dots, respectively (n = 3 biological replicates). Black dots represent proteins with no significant difference. Numbers within the panel denote the total number of proteins in each group. The list of differentially expressed proteins was generated using FragPipe-Analyst, and the Benjamin–Hochberg method was applied to correct for the FDR. (B,C) Molecular Signatures Database (MsigDB) hallmarks and KEGG enrichment analyses of the differentially expressed proteins were conducted using ShinyGO 0.80. Settings included selected species (human), FDR cut-off (0.05), and sorting by FDR. The total list of identified proteins was uploaded as the background. KEGG pathways and MsigDB hallmarks with significant enrichment (up to 10) are shown for the (B) upregulated and (C) downregulated differentially expressed proteins, sorted by fold enrichment. Circle size represents the number of proteins identified in each pathway/hallmark. DN, down-regulated; E2F, transcription factor E2F; IL2, interleukin 2; NFKB, nuclear factor kappa-B; PPAR, peroxisome proliferator-activated receptor; STAT5, signal transducer and activator of transcription 5; TNFA, tumor necrosis factor-alpha; UV, ultraviolet.
Figure 11
Figure 11
Heatmaps depicting the proteome profile of 72 peroxisome-associated proteins in LNCaP cells treated with the AR agonist R1881 relative to the vehicle. The relative protein abundances, expressed as Log2 FC, are shown on a false color scale with red for upregulation, white for equal expression, and blue for downregulation compared to vehicle-treated LNCaP cells. The cells were cultured in phenol red-free MEM supplemented with 10% (v/v) charcoal-stripped serum for 4 days, followed by treatment with either ethanol (vehicle) or 10 nM R1881. After one day, the medium was replaced with fresh ethanol- or R1881-containing medium. Two days later, cells were harvested and processed for proteomics analysis. Each box represents the average of 3 biological replicates, with Log2-FC shown only if the adjusted p-value is <0.05.
Figure 12
Figure 12
The AR agonist R1881 decreases catalase activity in LNCaP cells. LNCaP cells were cultured in phenol red-free MEM supplemented with 10% (v/v) charcoal-stripped serum for 4 days. The cells were then treated with either ethanol (vehicle) or 10 nM R1881. After one day, the medium was replaced with fresh medium containing ethanol, or R1881. Two days later, CAT activity was measured (n = 4). Error bars represent the standard deviation. Statistical significance was assessed using an unpaired T-test (**, p < 0.01).
Figure 13
Figure 13
Heatmaps showing the proteome profile of 36 primary and secondary antioxidant enzymes in LNCaP cells treated with the AR agonist R1881 compared to the vehicle. The cells were cultured in phenol red-free MEM supplemented with 10% (v/v) charcoal-stripped serum for 4 days. The cells were then treated with either ethanol (vehicle) or 10 mM R1881. After one day, the medium was replaced with fresh medium containing either ethanol or R1881. Two days later, cells were harvested and processed for proteomics analysis. Each box represents the average of 3 biological replicates, with Log2 FC shown only if the adjusted p-value is <0.05.

References

    1. Global Cancer Observatory: Cancer Today (Version 1.1); International Agency for Research on Cancer: Lyon, France. [(accessed on 9 September 2024)]. Available online: https://gco.iarc.who.int/today.
    1. Claessens F., Helsen C., Prekovic S., Van den Broeck T., Spans L., Van Poppel H., Joniau S. Emerging mechanisms of enzalutamide resistance in prostate cancer. Nat. Rev. Urol. 2014;11:712–776. doi: 10.1038/nrurol.2014.243. - DOI - PubMed
    1. Formaggio N., Rubin M.A., Theurillat J.P. Loss and revival of androgen receptor signaling in advanced prostate cancer. Oncogene. 2021;40:1205–1216. doi: 10.1038/s41388-020-01598-0. - DOI - PMC - PubMed
    1. Wu K., El Zowalaty A.E., Sayin V.I., Papagiannakopoulos T. The pleiotropic functions of reactive oxygen species in cancer. Nat. Cancer. 2024;5:384–399. doi: 10.1038/s43018-024-00738-9. - DOI - PubMed
    1. Battisti V., Maders L.D., Bagatini M.D., Reetz L.G., Chiesa J., Battisti I.E., Gonçalves J.F., Duarte M.M., Schetinger M.R., Morsch V.M. Oxidative stress and antioxidant status in prostate cancer patients: Relation to Gleason score, treatment and bone metastasis. Biomed. Pharmacother. 2011;65:516–524. doi: 10.1016/j.biopha.2011.06.003. - DOI - PubMed

LinkOut - more resources