

TORC1 Regulates Thermotolerance via Modulating Metabolic Rate and Antioxidant Capacity in Scallop Argopecten irradians irradians
- PMID: 39594501
- PMCID: PMC11591371
- DOI: 10.3390/antiox13111359
TORC1 Regulates Thermotolerance via Modulating Metabolic Rate and Antioxidant Capacity in Scallop Argopecten irradians irradians
Abstract
Target of rapamycin complex 1 (TORC1) is a key regulator of metabolism in eukaryotes across multiple pathways. Although TORC1 has been extensively studied in vertebrates and some invertebrates, research on this complex in scallops is limited. In this study, we identified the genes encoding TORC1 complex subunits in the scallop Argopecten irradians irradians through genome-wide in silico scanning. Five genes, including TOR, RAPTOR, LST8, DEPTOR, and PRAS40, that encode the subunits of TORC1 complex were identified in the bay scallop. We then conducted structural characterization and phylogenetic analysis of the A. i. irradians TORC1 (AiTORC1) subunits to determine their structural features and evolutionary relationships. Next, we analyzed the spatiotemporal expressions of AiTORC1-coding genes during various embryo/larvae developmental stages and across different tissues in healthy adult scallops. The results revealed stage- and tissue-specific expression patterns, suggesting diverse roles in development and growth. Furthermore, the regulation of AiTORC1-coding genes was examined in temperature-sensitive tissues (the mantle, gill, hemocyte, and heart) of bay scallops exposed to high-temperature (32 °C) stress over different durations (0 h, 6 h, 12 h, 24 h, 3 d, 6 d, and 10 d). The expression of AiTORC1-coding genes was predominantly suppressed in the hemocyte but was generally activated in the mantle, gill, and heart, indicating a tissue-specific response to heat stress. Finally, functional validation was performed using the TOR inhibitor rapamycin to suppress AiTORC1, leading to an enhanced catabolism, a decreased antioxidant capacity, and a significant reduction in thermotolerance in bay scallops. Collectively, this study elucidates the presence, structural features, evolutional relationships, expression profiles, and roles in antioxidant capacity and metabolism regulation of AiTORC1 in the bay scallop, providing a preliminary understanding of its versatile functions in response to high-temperature challenges in marine mollusks.
Keywords: Argopecten irradians irradians; TORC1; expression regulation; functional allocation; genome-wide identification; thermotolerance.
Conflict of interest statement
The authors declare that the research was conducted in the absence of any commercial or financial relationships that could be construed as a potential conflict of interest.
Figures


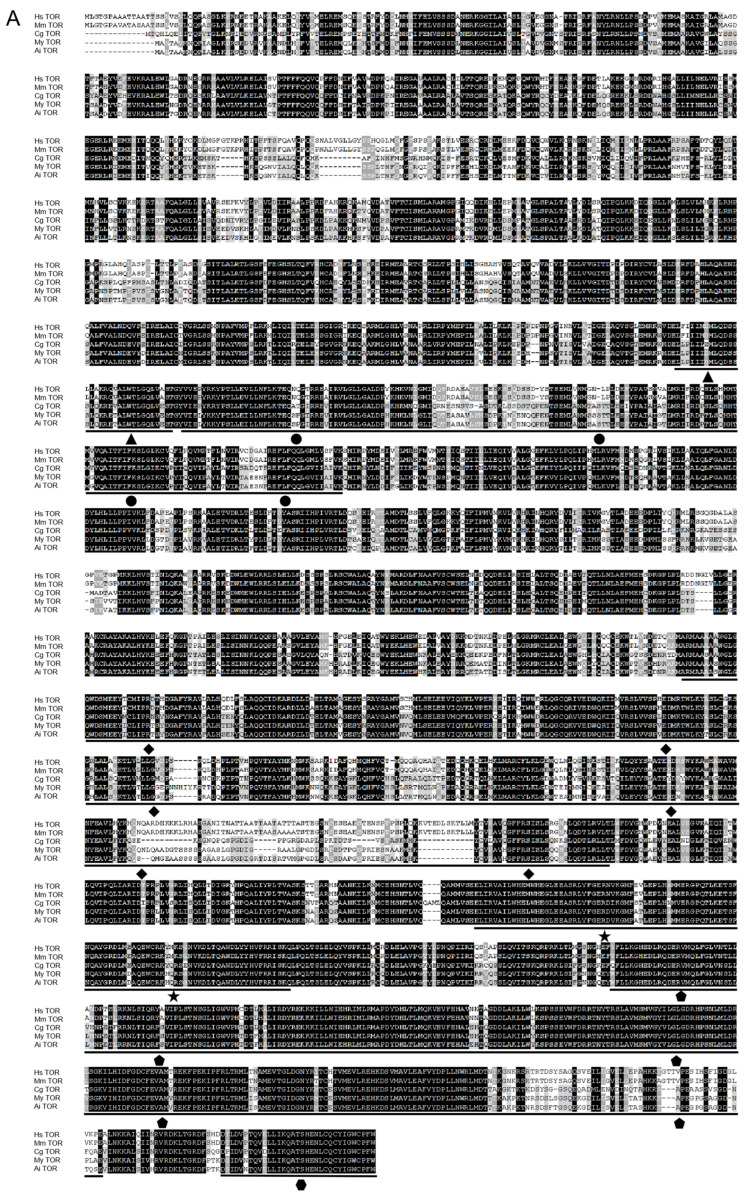
 represent HEAT domains,
the
represent HEAT domains,
the  represents DUF3385
domain, the
represents DUF3385
domain, the  represents FAT domain, the
  represents Rapamycin
bind domain, the
represents Rapamycin
bind domain, the  represents PI3Kc domain, the
  represents FATC
domain, the
represents FATC
domain, the  represents Raptor N domain, the
  represent WD40
domains, the
represent WD40
domains, the  represent DEP domains, the
  represents PDZ domain,
and the
represents PDZ domain,
and the  represents PRAS domain. Hs: H. sapiens, Mm: M. musculus,
Gg: G. gallus, Xl: X. laevis, Dr: D.
rerio, Ai: A. i. irradians, Pm: P. maximus,
My: M. yessoensis, Cg: C. gigas, Ca: C. angulata.
Accession numbers for these TORC1 subunits in other species are included in Supplementary Table S2.
represents PRAS domain. Hs: H. sapiens, Mm: M. musculus,
Gg: G. gallus, Xl: X. laevis, Dr: D.
rerio, Ai: A. i. irradians, Pm: P. maximus,
My: M. yessoensis, Cg: C. gigas, Ca: C. angulata.
Accession numbers for these TORC1 subunits in other species are included in Supplementary Table S2. represent HEAT domains,
the represents DUF3385
domain, the represents FAT domain, the represents Rapamycin
bind domain, the represents PI3Kc domain, the represents FATC
domain, the represents Raptor N domain, the represent WD40
domains, the represent DEP domains, the represents PDZ domain,
and the represents PRAS domain. Hs: H. sapiens, Mm: M. musculus,
Gg: G. gallus, Xl: X. laevis, Dr: D.
rerio, Ai: A. i. irradians, Pm: P. maximus,
My: M. yessoensis, Cg: C. gigas, Ca: C. angulata.
Accession numbers for these TORC1 subunits in other species are included in Supplementary Table S2.
represent HEAT domains,
the represents DUF3385
domain, the represents FAT domain, the represents Rapamycin
bind domain, the represents PI3Kc domain, the represents FATC
domain, the represents Raptor N domain, the represent WD40
domains, the represent DEP domains, the represents PDZ domain,
and the represents PRAS domain. Hs: H. sapiens, Mm: M. musculus,
Gg: G. gallus, Xl: X. laevis, Dr: D.
rerio, Ai: A. i. irradians, Pm: P. maximus,
My: M. yessoensis, Cg: C. gigas, Ca: C. angulata.
Accession numbers for these TORC1 subunits in other species are included in Supplementary Table S2.


References
-
- Garrabou J., Coma R., Bensoussan N., Bally M., Chevaldonné P., Cigliano M., Diaz D., Harmelin J.G., Gambi M.C., Kersting D.K., et al. Mass mortality in Northwestern Mediterranean rocky benthic communities: Effects of the 2003 heat wave. Glob. Change Biol. 2009;15:1090–1103. doi: 10.1111/j.1365-2486.2008.01823.x. - DOI
-
- Pearce A.F., Feng M. The rise and fall of the “marine heat wave” off Western Australia during the summer of 2010/2011. J. Mar. Syst. 2013;111–112:139–156. doi: 10.1016/j.jmarsys.2012.10.009. - DOI
-
- Bond N.A., Cronin M.F., Freeland H., Mantua N. Causes and impacts of the 2014 warm anomaly in the NE Pacific. Geophys. Res. Lett. 2015;42:3414–3420. doi: 10.1002/2015GL063306. - DOI
LinkOut - more resources
Full Text Sources
Miscellaneous
