Cecal Microbial Diversity and Metabolome Reveal a Reduction in Growth Due to Oxidative Stress Caused by a Low-Energy Diet in Donkeys
- PMID: 39594519
- PMCID: PMC11591121
- DOI: 10.3390/antiox13111377
Cecal Microbial Diversity and Metabolome Reveal a Reduction in Growth Due to Oxidative Stress Caused by a Low-Energy Diet in Donkeys
Abstract
Dietary energy level plays an important role in animal growth and development. The present study investigated the effect of dietary energy on the growth performance, antioxidative state, and nutrient digestion of meat donkeys. It simultaneously explored the probable reason for cecal microbiota and metabolome. Twelve meat donkeys (male) aged 1 year with a similar weight (150 ± 25 kg) were divided into two treatment groups: low-energy group (E1) and high-energy group (E2). The experiment was divided into a 10-day pre-trial period and a 135-day trial period. Donkeys in the trial periods were fed diets with digestible energy values (in dry matter) of 12.08 and 13.38 MJ/kg (pre-fattening, 1-45 d), 13.01 and 14.27 MJ/kg (mid-fattening, 46-90 d), and 13.54 and 14.93 MJ/kg (late-fattening, 91-135 d). The results show that E1 decreases body weight, average daily gain (ADG), and the digestibility of crude protein, ether extract, neutral detergent fiber, and acid detergent fiber (p < 0.05), but increases cecal acetate and butyrate concentrations, non-esterified fatty acids (NEFAs) in serum, and the ratio of dry matter intake to ADG(F/G). E1 diminished the activities of catalase and glutathione peroxidase, while it increased the content of interleukin, tumor necrosis factor-alpha, and reactive oxygen species (ROS) (p < 0.05). Cecal microbiome showed that the abundance of Firmicutes and Actinobacteria in E1 was significantly lower than in E2 (p = 0.029, p = 0.002), whereas Bacteroidetes was higher (p = 0.005). E1 increased the genera Ruminococcaceae-UCG-004, Acinetobacter, and Rikenellaceae_RC9_gut_group. Meanwhile, cecal metabolome showed that formyl-5-hydroxykynurenamine, chorismate, 3-sulfinoalanine, and 3-isopropylmalate were upregulated in E1, while brassinolide was downregulated. The altered metabolites were mainly enriched in metabolic pathways related to energy metabolism and metabolism to mitigate oxidative stress in the meat donkeys, such as tryptophan metabolism, brassinosteroid biosynthesis metabolism, etc. In conclusion, low-energy diets resulted in a negative energy balance in meat donkeys, resulting in more nutrients being oxidized to provide energy, inducing oxidative stress, and thereby leading to decreasing growth. The reduction in meat donkey growth from low-energy diets was related to changes in cecum microbiota and metabolites.
Keywords: cecal microbiome and metabolome; dietary energy; growth performance; meat donkey; oxidative stress.
Conflict of interest statement
Author Yongwei Zhang is employed by Inner Mongolia Grassland Yulv Science and Technology Animal Husbandry Co., Ltd. The remaining authors declare that the research was conducted in the absence of any commercial or financial relationships that could be construed as a potential conflict of interest.
Figures


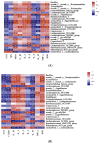
 ” represents a positive increase, “
  ” represents a negative increase, and “
  ” represents a negative decrease.
Similar articles
-
Dietary Energy Level Impacts the Performance of Donkeys by Manipulating the Gut Microbiome and Metabolome.Front Vet Sci. 2021 Oct 8;8:694357. doi: 10.3389/fvets.2021.694357. eCollection 2021. Front Vet Sci. 2021. PMID: 34692802 Free PMC article.
-
Rectal microbiomes and serum metabolomics reveal the improved effect of Artemisia ordosica crude polysaccharides on the lactation performance, antioxidant status, and immune responses of lactating donkeys.J Dairy Sci. 2024 Sep;107(9):6696-6716. doi: 10.3168/jds.2023-24570. Epub 2024 Apr 11. J Dairy Sci. 2024. PMID: 38608958
-
Impact of dietary protein and energy levels on fatty acid profile, gut microbiome and cecal metabolome in native growing chickens.Poult Sci. 2024 Aug;103(8):103917. doi: 10.1016/j.psj.2024.103917. Epub 2024 May 29. Poult Sci. 2024. PMID: 38909505 Free PMC article.
-
Impact of feeding dried distillers' grains with solubles diet on microbiome and metabolome of ruminal and cecal contents in Guanling yellow cattle.Front Microbiol. 2023 Sep 18;14:1171563. doi: 10.3389/fmicb.2023.1171563. eCollection 2023. Front Microbiol. 2023. PMID: 37789852 Free PMC article.
-
Effects of dietary energy level on antioxidant capability, immune function and rectal microbiota in late gestation donkeys.Front Microbiol. 2024 Feb 13;15:1308171. doi: 10.3389/fmicb.2024.1308171. eCollection 2024. Front Microbiol. 2024. PMID: 38414765 Free PMC article.
Cited by
-
Advances in Donkey Disease Surveillance and Microbiome Characterization in China.Microorganisms. 2025 Mar 26;13(4):749. doi: 10.3390/microorganisms13040749. Microorganisms. 2025. PMID: 40284586 Free PMC article. Review.
References
-
- Gustavo F.C., Jorge E.C.L., Lawrence D.O.B. The current situation and trend of the donkey industry in South America. J. Equine Vet. Sci. 2018;65:106–110. doi: 10.1016/j.jevs.2018.03.007. - DOI
-
- Zhang H., Zhang X., Wang Z., Dong X., Tan C., Zou H., Peng Q., Xue B., Wang L., Dong G. Effects of dietary energy level on lipid metabolism-related gene expression in subcutaneous adipose tissue of Yellow breed x Simmental cattle. Anim. Sci. J. 2015;86:392–400. doi: 10.1111/asj.12316. - DOI - PubMed
-
- Yerradoddi R.R., Khan A.A., Mallampalli S.R., Devulapalli R., Kodukula P., Blümmel M. Effect of protein and energy levels in sweet sorghum bagasse leaf residue-based diets on the performance of growing Deccani lambs. Trop. Anim. Health Prod. 2015;47:743–749. doi: 10.1007/s11250-015-0788-5. - DOI - PubMed
Grants and funding
LinkOut - more resources
Full Text Sources

