. 2024 Nov 5;13(22):1825.
doi: 10.3390/cells13221825.

TMEM206 Contributes to Cancer Hallmark Functions in Colorectal Cancer Cells and Is Regulated by p53 in a p21-Dependent Manner

Affiliations

TMEM206 Contributes to Cancer Hallmark Functions in Colorectal Cancer Cells and Is Regulated by p53 in a p21-Dependent Manner

Korollus Melek et al. Cells. .

Abstract

Acid-induced ion flux plays a role in pathologies where tissue acidification is prevalent, including cancer. In 2019, TMEM206 was identified as the molecular component of acid-induced chloride flux. Localizing to the plasma membrane, TMEM206 contributes to cellular processes like acid-induced cell death. Since over 50% of human cancers carry loss of function mutations in the p53 gene, we aimed to analyze how TMEM206 is regulated by p53 and its role in cancer hallmark function and acid-induced cell death in HCT116 colorectal cancer (CRC) cells. We generated p53-deficient HCT116 cells and assessed TMEM206-mediated Cl- currents and transcriptional regulation using the patch-clamp and a dual-luciferase reporter assay, respectively. To investigate the contribution of TMEM206 to cancer hallmark functions, we performed migration and metabolic activity assays. The role of TMEM206 in p53-mediated acid-induced cell death was assessed with cell death assays. The TMEM206 mRNA level was significantly elevated in human primary CRC tumors. TMEM206 knockout increased acid-induced cell death and reduced proliferation and migration, indicating a role for TMEM206 in these cancer hallmark functions. Furthermore, we observed increased TMEM206 mRNA levels and currents in HCT116 p53 knockout cells. This phenotype can be rescued by transient overexpression of p53 but not by overexpression of dysfunctional p53. In addition, our data suggest that TMEM206 may mediate cancer hallmark functions within p53-associated pathways. TMEM206 promoter activity is not altered by p53 overexpression. Conversely, knockout of p21, a major target gene of p53, increased TMEM206-mediated currents, suggesting expression control of TMEM206 by p21 downstream signaling. Our results show that in colorectal cancer cells, TMEM206 expression is elevated, contributes to cancer hallmark functions, and its regulation is dependent on p53 through a p21-dependent mechanism.

Keywords: TMEM206; acid-induced cell death; colorectal cancer; ion channel; p21; p53.


Conflict of interest statement

The authors declare no conflicts of interest.

Figures

Figure 1
Figure 1
TMEM206 expression in different types of cancer, human primary CRC, TMEM206 expression, and currents in HCT116 and p53 KO cells. (A) TMEM206 RNA expression in different types of cancer. FPKM = number Fragments Per Kilobase of exon per Million reads. (B) TMEM206 expression in human primary CRC tumors versus mucosa tissue. Statistical differences were determined by a two-tailed Mann–Whitney test (n = 77 to 117 samples, mean ± SEM). (C) TMEM206 mRNA expression relative to TBP and Pol2RA (N = 3 independent experiments, mean ± SEM). (D) TMEM206-mediated current densities evoked with pH 4.5 in HCT116 cells (n = 7 cells, mean ± SEM), p53 KO1 (n = 6 cells, mean ± SEM) and p53 KO2 (n = 7 cells, mean ± SEM) and corresponding current-voltage relationships (inset). (E) Current densities extracted from (D) at t = 218 s (mean ± SEM). Statistical differences were determined by the Kruskal–Wallis test; ** p < 0.002, and *** p < 0.001.
Figure 2
Figure 2
p53 rescue experiments in p53 KO and LNCaP cells. (A) TMEM206-mediated current densities in p53 KO1 after transient overexpression of p53 WT, p53 MUT, or the empty vector control. Currents were evoked with a pH 4.5 solution (n = 5 cells, mean ± SEM). Corresponding current–voltage relationships are shown in the inset. (B) Current densities extracted from (A) at t = 218 s (mean ± SEM). (C) TMEM206-mediated outward currents in p53 KO2 after transient overexpression of either p53 WT, p53 MUT, or the empty vector control. Currents were evoked with a pH 4.5 solution (n = 5 to 6 cells, mean ± SEM). Corresponding current–voltage relationships are shown in the inset. (D) Current densities extracted from (C) at t = 218 s (mean ± SEM). (E) TMEM206-mediated outward currents in LNCaP cells after transient overexpression of either p53 WT, p53 MUT, or the empty vector control. Currents were evoked with a pH 4.5 solution (n = 4 to 5 cells, mean ± SEM). Corresponding current–voltage relationships are shown in the inset. (F) Current densities extracted from (E) at t = 218 s (mean ± SEM). Statistical differences were determined by ordinary one-way ANOVA; ** p < 0.002.
Figure 3
Figure 3
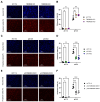
Acid-induced cell death in HCT116, p53 KO, TMEM206 KO, and p53/TMEM206 DKO. (A) Representative images of Hoechst 3342 (upper panel) and propidium iodide (lower panel) cell staining in HCT116 and TMEM206 KO1 and TMEM206 KO2 after 2.5 h of treatment with pH 4.5. (B) Statistical analysis of live-to-dead cell ratios (PI/Hoechst 3342) of HCT116 (N = 4 independent experiments, mean ± SEM) and TMEM206 KO clones (N = 3 independent experiments, mean ± SEM). (C) Representative images of Hoechst 3342 (upper panel) and propidium iodide (lower panel) cell staining in HCT116 (same cells as in A) and p53 KO1 and p53 KO2 after 2.5 h of treatment with pH 4.5. (D) Statistical analysis of live-to-dead cell ratios (PI/Hoechst 3342) of HCT116 (N = 4 independent experiments, mean ± SEM) and p53 KO clones (N = 4 independent experiments, mean ± SEM). (E) Representative images of Hoechst 3342 (upper panel) and propidium iodide (lower panel) cell staining in HCT116 (same cells as in A) and p53/TMEM206 DKO1 and p53/TMEM206 DKO2 after 2.5 h of treatment with pH 4.5. (F) Statistical analysis of live-to-dead cell ratios (PI/Hoechst 3342) of HCT116 (N = 4 independent experiments, mean ± SEM) and p53/TMEM knockout clones (N = 4 independent experiments, mean ± SEM). Statistical differences were determined by two-way ANOVA;** p < 0.002, *** p < 0.001.
Figure 4
Figure 4
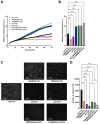
Proliferation and migration of HCT116, TMEM206 KO, p53 KO, and p53/TMEM206 DKO. (A) Proliferation measured over 72 h of HCT116, TMEM206 KO1 and KO2, p53 KO1 and p53 KO2, and p53/TMEM206 DKO (N = 4 independent experiments, mean). (B) Relative luminescence at 72 h extracted from (A) (mean ± SEM). (C) Representative images of migrated cells after 48 h (N = 4 independent experiments). (D) The number of migrated cells extracted from (C) (mean ± SEM). Statistical differences were determined by ordinary one-way ANOVA; ** p < 0.002, and *** p < 0.001.
Figure 5
Figure 5
Mechanism of p53-mediated repression of TMEM206. (A) Normalized luminescence from dual luciferase assays after transient overexpression of p53 WT and p53 MUT in HCT116 cells (N = 3 independent experiments, mean ± SEM). (B) Relative mRNA expression in HCT116 and HCT116 p21 knockout cells (N = 4 independent experiments, mean ± SEM). (C) TMEM206-mediated outward currents in HCT116 (n = 8 cells) and HCT116 p21 knockout (n = 7 cells) cells. Currents were evoked with a pH 4.5 solution (mean ± SEM). Corresponding current–voltage relationships are shown in the inset. (D) Current densities extracted from (C) at t = 218 s (mean ± SEM). (E) TMEM206-mediated outward currents in HCT116 p21 KO after transient overexpression of p53 WT (n = 7 cells), p21 WT (n = 5 cells), or the empty vector control (n = 5 cells). Currents were evoked with a pH 4.5 solution (mean ± SEM). Corresponding current–voltage relationships are shown in the inset. (F) Current densities extracted from (E) at t = 218 s. Statistical differences were determined by ordinary one-way ANOVA; ** p < 0.002.

Similar articles

References

    1. Anderson N.M., Simon M.C. The Tumor Microenvironment. Curr. Biol. 2020;30:R921–R925. doi: 10.1016/j.cub.2020.06.081. - DOI - PMC - PubMed
    1. Barba I., Carrillo-Bosch L., Seoane J. Targeting the Warburg Effect in Cancer: Where Do We Stand? Int. J. Mol. Sci. 2024;25:3142. doi: 10.3390/ijms25063142. - DOI - PMC - PubMed
    1. Boedtkjer E., Pedersen S.F. The Acidic Tumor Microenvironment as a Driver of Cancer. Annu. Rev. Physiol. 2020;82:103–126. doi: 10.1146/annurev-physiol-021119-034627. - DOI - PubMed
    1. Dai G., Doisy E.A. Signaling by Ion Channels: Pathways, Dynamics and Channelopathies. Mo. Med. 2023;120:367. - PMC - PubMed
    1. Bell D.C., Leanza L., Gentile S., Sauter D.R. News and Views on Ion Channels in Cancer: Is Cancer a Channelopathy? Front. Pharmacol. 2023;14:1258933. doi: 10.3389/fphar.2023.1258933. - DOI

Publication types

MeSH terms

Substances