. 2024 Nov 6;13(22):1835.
doi: 10.3390/cells13221835.

Modeling Lymphoma Angiogenesis, Lymphangiogenesis, and Vessel Co-Option, and the Effects of Inhibition of Lymphoma-Vessel Interactions with an αCD20-EndoP125A Antibody Fusion Protein

Affiliations

Modeling Lymphoma Angiogenesis, Lymphangiogenesis, and Vessel Co-Option, and the Effects of Inhibition of Lymphoma-Vessel Interactions with an αCD20-EndoP125A Antibody Fusion Protein

Christian Elledge et al. Cells. .

Abstract

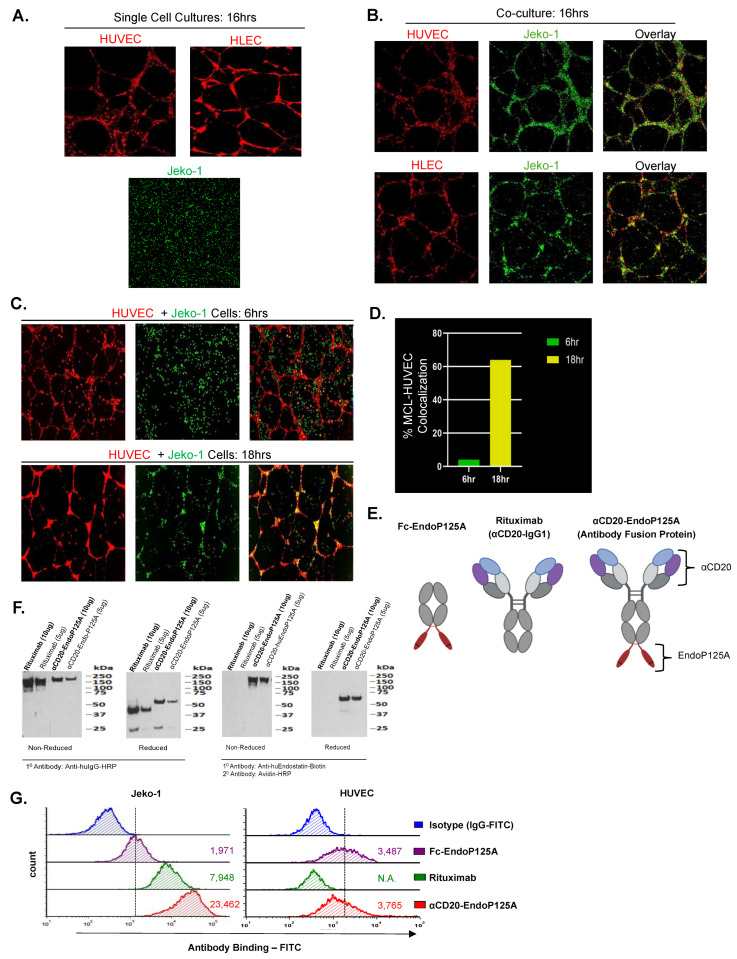
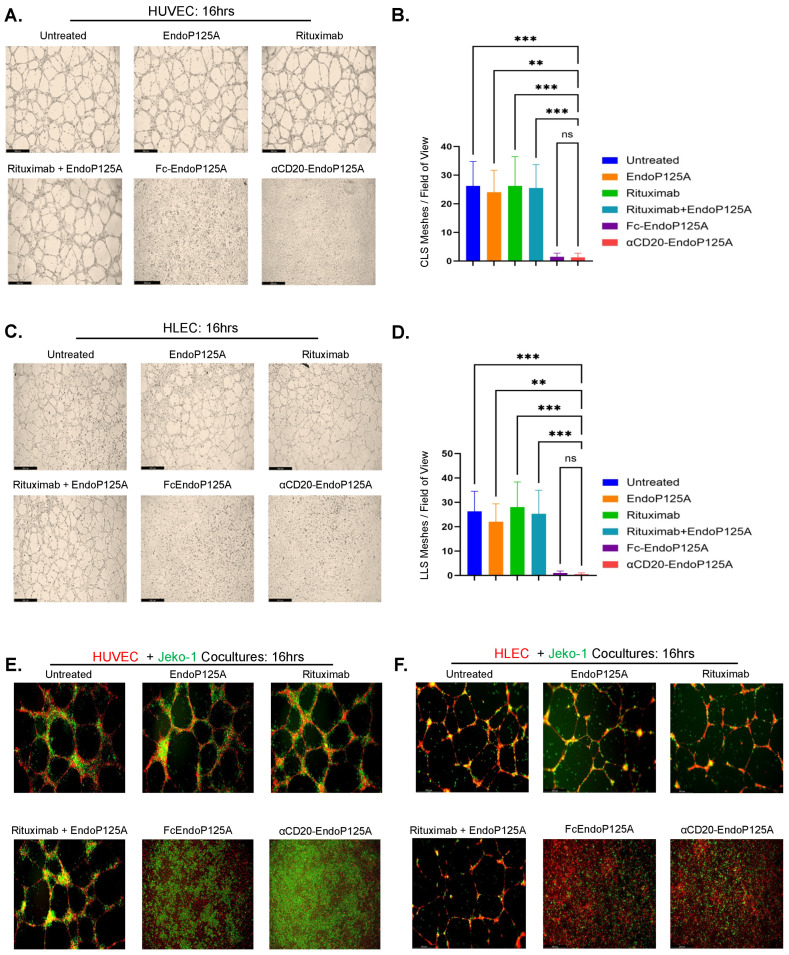
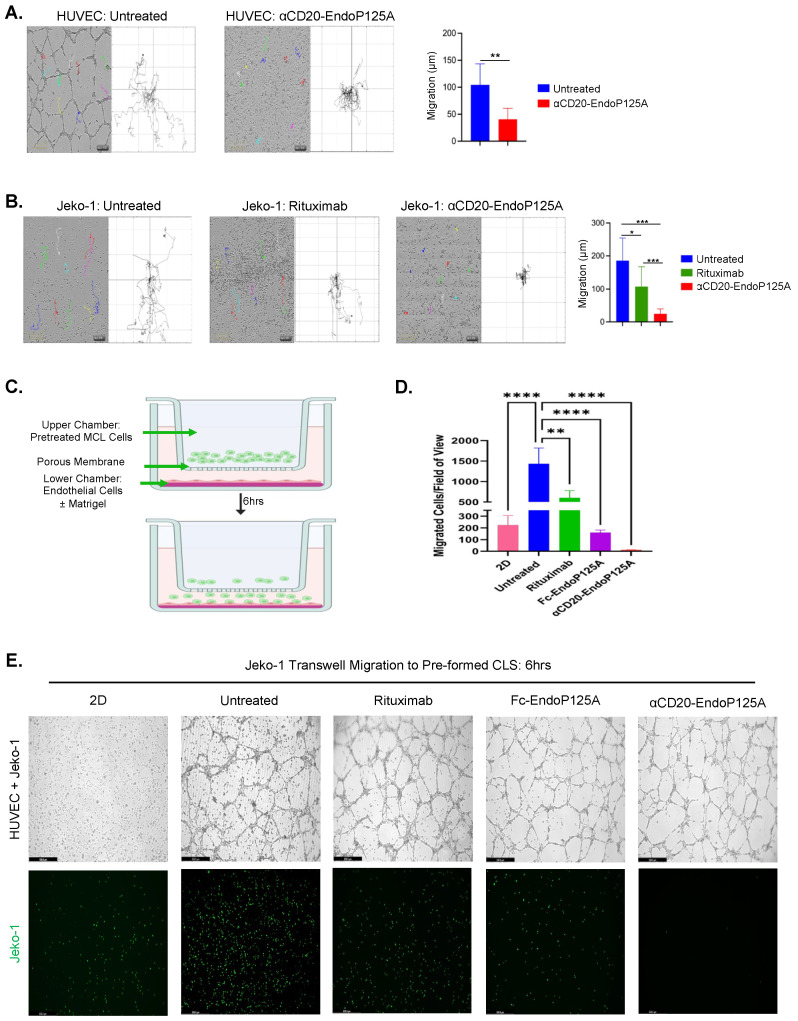
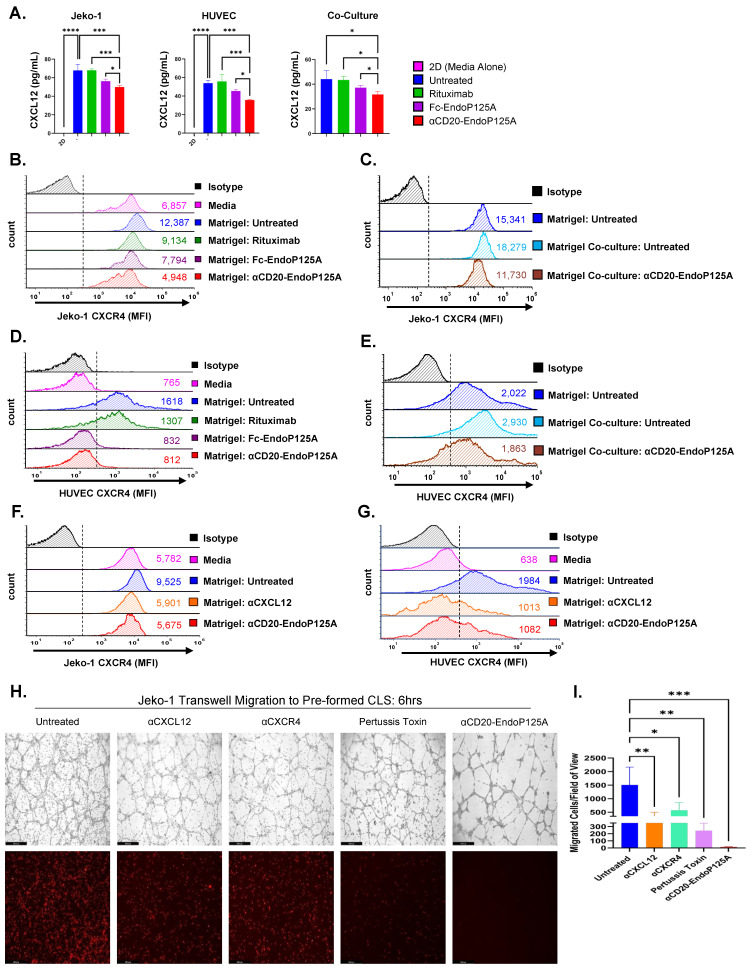
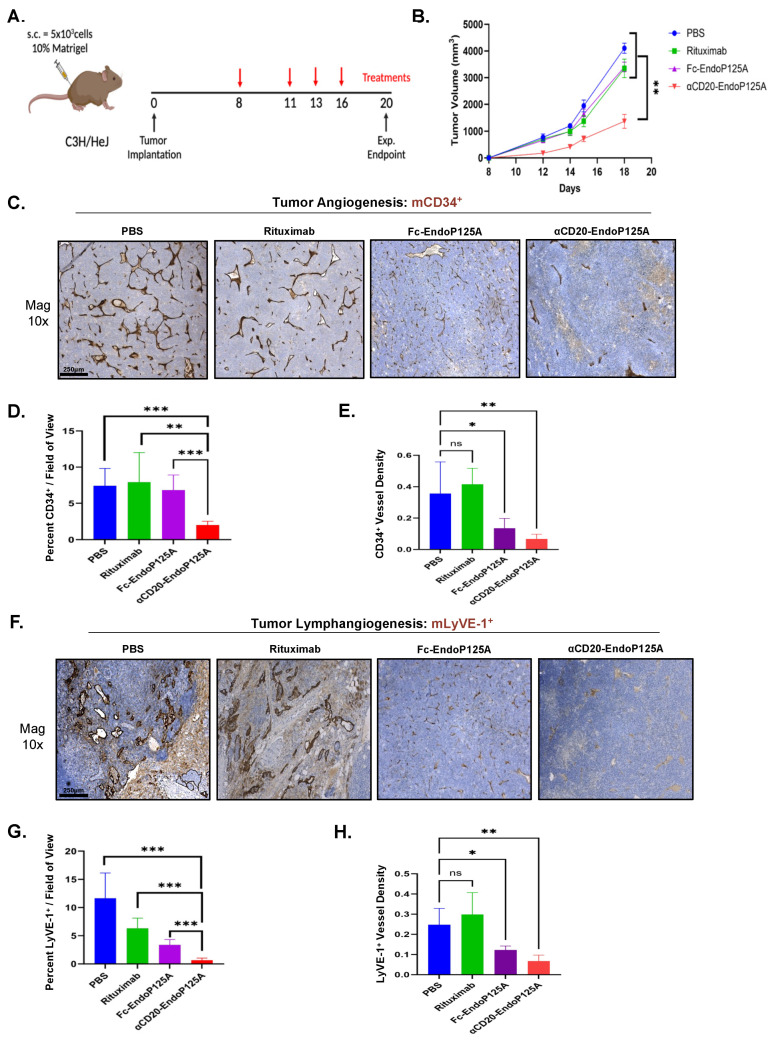
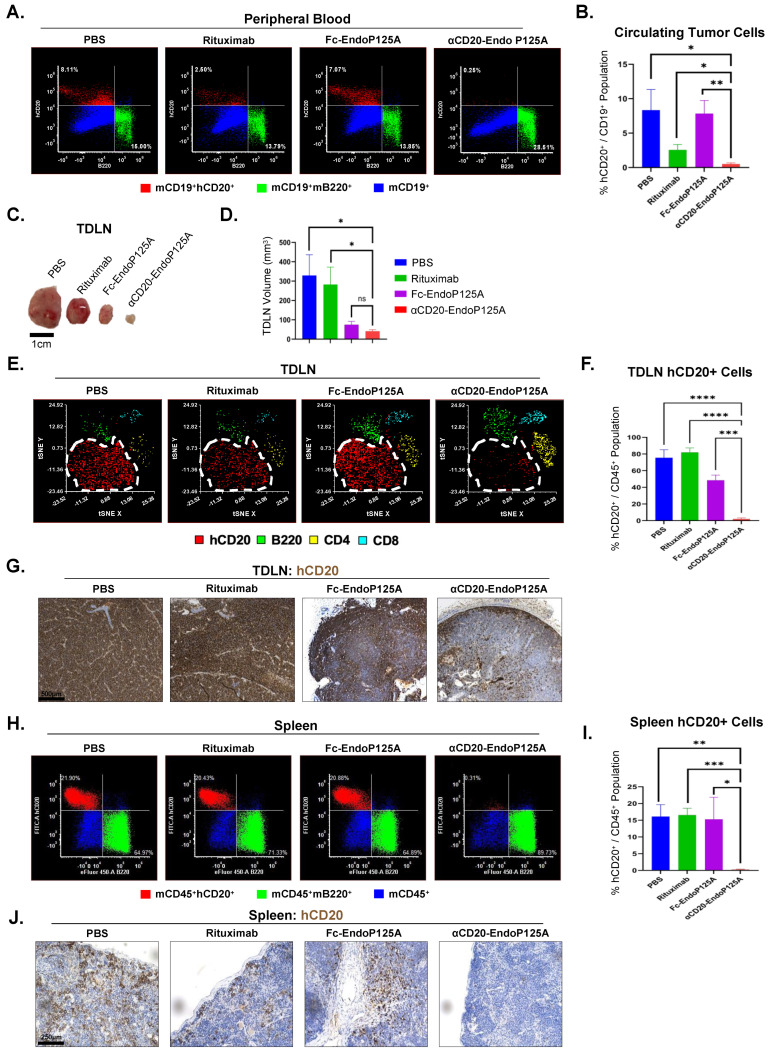
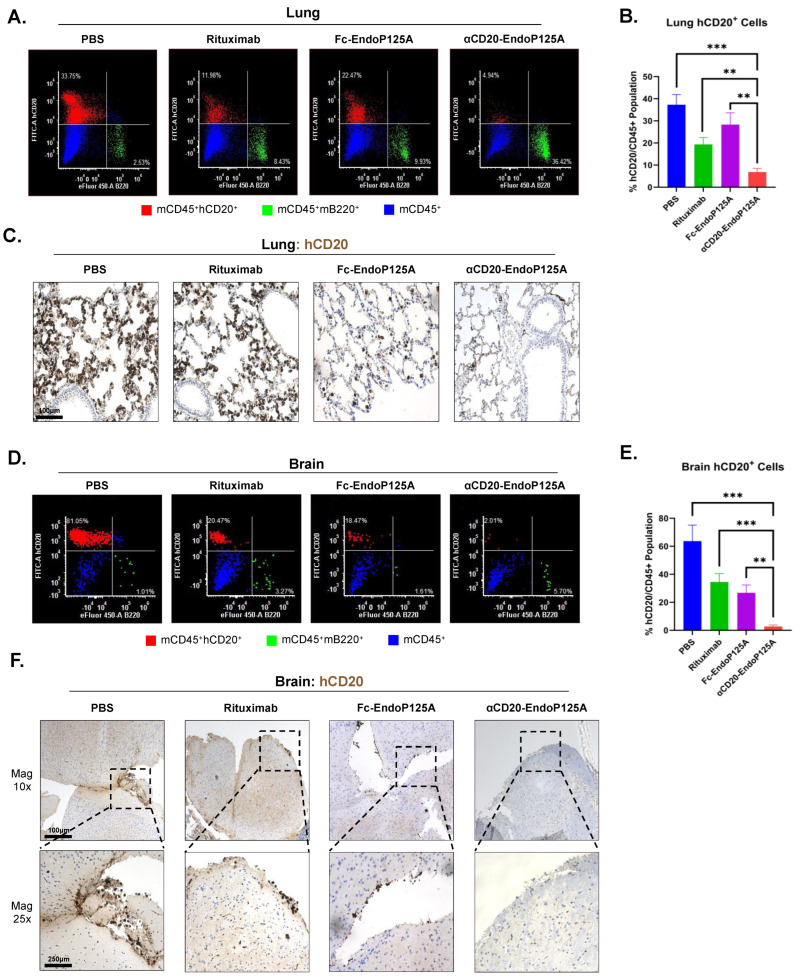
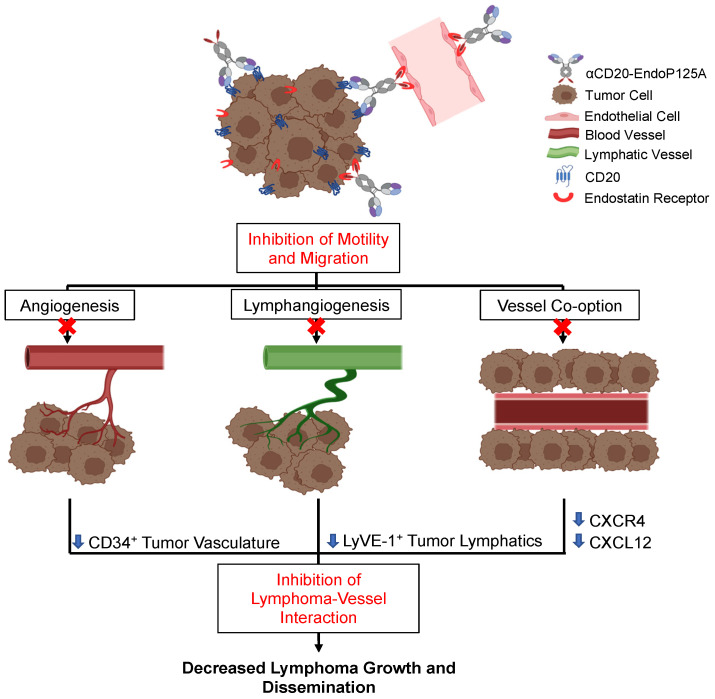
Lymphoma growth, progression, and dissemination require tumor cell interaction with supporting vessels and are facilitated through tumor-promoted angiogenesis, lymphangiogenesis, and/or lymphoma vessel co-option. Vessel co-option has been shown to be responsible for tumor initiation, metastasis, and resistance to anti-angiogenic treatment but is largely uncharacterized in the setting of lymphoma. We developed an in vitro model to study lymphoma-vessel interactions and found that mantle cell lymphoma (MCL) cells co-cultured on Matrigel with human umbilical vein (HUVEC) or human lymphatic (HLEC) endothelial cells migrate to and anneal with newly formed capillary-like (CLS) or lymphatic-like (LLS) structures, consistent with lymphoma-vessel co-option. To inhibit this interaction, we constructed an antibody fusion protein, αCD20-EndoP125A, linking mutant anti-angiogenic endostatin (EndoP125A) to an αCD20-IgG1-targeting antibody. αCD20-EndoP125A inhibited both CLS and LLS formation, as well as MCL migration and vessel co-option. Lymphoma vessel co-option requires cell migration, which is regulated by chemokine-chemokine receptor interactions. CXCL12 and its receptor, CXCR4, are highly expressed by both endothelial cells forming CLS and by MCL cells during vessel co-option. αCD20-EndoP125A suppressed expression of both CXCL12 and CXCR4, which were required to facilitate CLS assembly and vessel co-option. We also tested αCD20-EndoP125A effects in vivo using an aggressive murine B cell lymphoma model, 38c13-hCD20, which demonstrated rapid growth and dissemination to tumor-draining lymph nodes (TDLNs) and the spleen, lung, and brain. The pattern of lymphoma distribution and growth within the lung was consistent with vessel co-option. As predicted by our in vitro model, αCD20-EndoP125A treatment inhibited primary tumor growth, angiogenesis, and lymphangiogenesis, and markedly reduced the number of circulating tumor cells and lymphoma dissemination to TDLNs and the lungs, spleen, and brain. αCD20-EndoP125A inhibited lymphoma vessel co-option within the lung. Marked inhibition of MCL primary tumor growth and dissemination were also seen using an MCL xenograft model. The ability of αCD20-EndoP125A to inhibit angiogenesis, lymphangiogenesis, and lymphoma vessel co-option provides a novel therapeutic approach for inhibition of lymphoma progression and dissemination.

Keywords: angiogenesis; antibody fusion; endostatin; lymphangiogenesis; lymphoma; mantle cell lymphoma; vessel co-option.


Conflict of interest statement

Author Rathin Das was employed by the Synergys Biotherapeutics Inc. The remaining authors declare that the research was conducted in the absence of any commercial or financial relationships that could be construed as a potential conflict of interest.

Figures

Figure 1
Figure 1
MCL migrates to and associates with lymphatic/vascular endothelial cells undergoing capillary-like structure (CLS) or lymphatic-like structure (LLS) assembly. Structure and binding of antibody fusion: αCD20-EndoP125A: (AC) HUVECs or HLECs were labeled with calcein red and MCLs were labeled with calcein green. Cells were either cultured alone or co-cultured on Matrigel. Images were captured and displayed at 10× magnification. (A) Cultured-alone HUVECs form CLS, HLECs form LLS, and Jeko-1 MCL cells randomly disperse on Matrigel. (B) Jeko-1 cells co-cultured with HUVECs or with HLECs associated and aligned with CLS or LLS, respectively. (C) HUVECs were cultured on Matrigel for 6 h to form CLS. Jeko-1 cells were then seeded onto the pre-formed CLS. After an additional 12 h, Jeko-1 cells had migrated to and aligned with the pre-formed CLS. Pearson’s Coefficients were calculated using the ImageJ JACoP plugin to quantify Jeko-1:HUVEC colocalization: 6 h R = 0.069, 18 h R = 0.446. (D) Percentage of total Jeko-1 cells colocalized with HUVEC CLS at 6 h and 18 h. (E) Schematic rendering of antibodies and the antibody fusion protein: Fc-EndoP125A, which lacks variable targeting sequences, Rituximab, and the antibody fusion αCD20-EndoP125A, with αCD20 and EndoP125A domains indicated. The details are in the text. (F) Western blot confirmation of endostatinP125A bound to the heavy chain of the antibody. Antibody proteins were either non-reduced to measure the full-length antibody or reduced to measure the heavy and light chains of the antibody. To detect IgG1, IgG1-HRP was used. To detect endostatin, anti-human biotinylated was used as the primary antibody, and Avidin-HRP was used as the secondary antibody. (G) Flow cytometry of αCD20-EndoP125A binding to Jeko-1 and HUVEC cells compared to Rituximab and Fc-EndoP125A. Dotted line indicates gating, and the calculated MFI is indicated.
Figure 2
Figure 2
αCD20-EndoP125A inhibits the formation of CLS and LLS and consequently the association and alignment of MCL cells with CLS or LLS: (AF) Cell cultures were cultured on Matrigel for 16h and either left untreated or treated with equimolar EndoP125A(2 μg/mL), Rituximab(6.8 μg/mL), EndoP125A + Rituximab, Fc-EndoP125A(3.5 μg/mL), or αCD20-EndoP125A(10 μg/mL). (A) HUVECs cultured on Matrigel for 16 h with indicated treatments. Images were captured and displayed at 5× magnification. (B) The number of tubule meshes formed in triplicate wells per treatment was calculated using the ImageJ angiogenesis analyzer and used to quantify the amount of CLS. Results are the mean number of meshes per 10× field of view ± Standard Deviation (SD). (C) HLECs cultured on Matrigel for 16 h with indicated treatments. Images were captured and displayed at 5× magnification (D) The number of tubule meshes formed in triplicate wells per treatment used to quantify the amount of LLS. Results are the mean number of meshes per 10× field of view ± SD. (E) HUVECs or (F) HLECs were labeled with calcein red, and Jeko-1 cells were labeled with calcein green. Cells were co-cultured on Matrigel for 16h with indicated treatments. Images were captured and displayed at 10× magnification Pearson’s Coefficients calculated to quantify MCL colocalization with CLS (Untreated R = 0.353, EndoP125A R = 0.387, Rituximab R = 0.438, EndoP125A + Rituximab R = 0.422, Fc-EndoP125A R = 0.079, and αCD20-EndoP125A R = 0.129) and MCL colocalization with LLS (Untreated R = 0.375, EndoP125A R = 0.495, Rituximab R = 0.282, EndoP125A + Rituximab R = 0.293, Fc-EndoP125A R = −0.018, and αCD20-EndoP125A R = −0.021). p-value < 0.05 was considered statistically significant or marked ns for not significant. Indicated p-values are * < 0.05, ** < 0.01, *** < 0.001, and **** < 0.0001.
Figure 3
Figure 3
αCD20-EndoP125A significantly reduces MCL and endothelial cell motility and migration: (A) HUVEC or (B) Jeko-1 cells were cultured for 16h on Matrigel and were either untreated or treated with equimolar Rituximab (6.8 μg/mL) or αCD20-EndoP125A(10 μg/mL). Cells were randomly selected, and individual cell movements were tracked and plotted. Images displayed are 10× magnification and captured at the 16hr time point. The migration track of each individual cell is assigned a unique color. Corresponding spider plots display individual cell tracks starting at the plot’s origin and depict migration away from the point of origin. Distances traveled were quantified, averaged, and graphed. Results are the mean cell migration ± SD of 10 randomly chosen cells/condition. (C) Schematic rendering of transwell migration assay. In the lower chamber of a 24-well plate, 1.5 × 10⁵ HUVEC cells were cultured in Media alone to grow as a monolayer (labelled 2D) or on Matrigel to form CLS. Jeko-1 MCL cells were labeled with calcein green and pre-treated for 1hr with equimolar Rituximab (6.8 μg/mL), Fc-EndoP125A (3.5 μg/mL), or αCD20-EndoP125A (10 μg/mL). MCL cells were washed, 2.0 × 10⁵ cells were seeded in the top chamber, and transwells were incubated at 37 °C for 6 h. (D) Migration of green, fluorescent Jeko-1 cells to the bottom chamber of 4 wells per treatment was quantified by ImageJ software. Results are the mean number of migrated cells ± SD. (E) Representative images of the bottom chamber of transwell migration assays. Images were captured and displayed at 10× magnification. Top panel: phase contrast images depicting the endothelial monolayer or CLS, and Jeko-1 cells that migrated to the bottom chamber. Bottom panel: fluorescent images of the bottom chamber depicting green, fluorescent Jeko-1 cells that migrated to endothelial cells. p-value < 0.05 was considered statistically significant or marked ns for not significant. Indicated p-values are * < 0.05, ** < 0.01, *** < 0.001, and **** < 0.0001.
Figure 4
Figure 4
αCD20-EndoP125A reduces the expression of CXCL12 and CXCR4, which are critical for CLS formation and MCL vessel co-option: (A) Jeko-1, HUVEC, or Jeko-1:HUVEC cocultures were cultured in media alone (labeled 2D) or on Matrigel for 6h. Cultures were left untreated or treated with equimolar Rituximab (6.8 µg/mL), Fc-EndoP125A (3.5 µg/mL), or αCD20-EndoP125A (10 µg/mL). Supernatant was collected from triplicate wells per condition and ProcartaPlex Multi-Analyte Protein assays were performed to quantify analyte concentrations. Results are CXCL12 concentrations for indicated cultures and treatments ± SD (BG) Jeko-1, HUVEC, or Jeko-1:HUVEC co-cultures were cultured in media alone or on Matrigel and left untreated or treated with Rituximab (6.8 µg/mL), Fc-EndoP125A (3.5 µg/mL), αCXCL12 (10 µg/mL), or αCD20-EndoP125A (10 µg/mL). Cells were recovered, stained, and flow cytometry was performed for CXCR4 expression. Dotted line indicates gating for CXCR4+ cells and calculated MFI is displayed. (F,G) Effects on CXCR4 expression through CXCL12 inhibition with an αCXCL12 antibody compared to αCD20-EndoP125A. (H) Transwell assays were performed as indicated previously (Figure 3C) to measure the effect of chemokine inhibitors compared to αCD20-EndoP125A. Treatment concentrations used were αCXCL12 (10 µg/mL), αCXCR4 (10 µg/mL), Pertussis Toxin (200 ng/mL), and αCD20-EndoP125A (10 µg/mL). Images were captured and displayed at 10× magnification. Top panel: phase contrast images of the bottom chamber depicting HUVEC CLS and Jeko-1 cells that migrated to the bottom chamber. Bottom panel: fluorescent images of the bottom chamber, depicting red, fluorescent Jeko-1 cells that migrated to endothelial cells. (I) Cell migration quantified by counting the number of red, fluorescent cells in the bottom chamber of 4 wells per treatment. Results are the mean number of migrated cells ± SD. P-value < 0.05 was considered statistically significant or marked ns for not significant. Indicated p-values are * < 0.05, ** < 0.01, *** < 0.001, and **** < 0.0001.
Figure 5
Figure 5
αCD20-EndoP125A reduces tumor growth, angiogenesis, and lymphangiogenesis: (A) Schematic rendering of the 38c13-hCD20 in vivo experiment. In total, 5 × 10³ 38c13-hCD20 cells suspended in 200 μL PBS containing 10% Matrigel were implanted s.c. in the right hind flank of C3H mice. A total of 10 mice/group were treated with 200 μL of PBS, or PBS containing equimolar Rituximab (136 μg/200 μL), Fc-EndoP125A (68 μg/200 μL), or αCD20-EndoP125A (200 μg/200 μL) on days 8, 11, 13, and 16. Mice were sacrificed on day 20 and tumors, peripheral blood, and organs were collected. (B) Mean tumor volume ± SEM of 10 mice/treatment group. (C) Representative images of tumor angiogenesis by IHC for mCD34. Quantification of tumor angiogenesis measured by (D) Percent mCD34+ per five 25× fields of view and by (E) Mean Vessel Density (MVD) per five 25× fields of view calculated by ImageJ software. (F) Representative images of tumor lymphangiogenesis by IHC staining tumors for mLyVE-1. Quantification of tumor lymphangiogenesis measured by (G) Percent mLyVE-1+ per five 25× fields of view of and by (H) MVD per five 25× fields of view calculated by ImageJ software. p-value < 0.05 was considered statistically significant or marked ns for not significant. Indicated p-values are * < 0.05, ** < 0.01, *** < 0.001, and **** < 0.0001.
Figure 6
Figure 6
αCD20-EndoP125A reduces circulatory tumor cells (CTCs) and dissemination to tumor-draining lymph nodes (TDLN) and the spleen: (A) Representative flow cytometry of peripheral blood (PB) gated on mCD19+ cells depicting hCD20+ circulating tumor cells (CTCs, red) and mB220+ normal murine B cells (green). (B) Flow cytometry quantification of percentage of 38c13-hCD20 cells within PB. Results are the mean percentage of hCD20+ cells within the CD19+ population ± SD of 5 PB/treatment group. (C) Representative images of TDLN. (D) TDLN volume ± SD of 5 TDLN/treatment group. (E) tSNE plots indicating disseminated hCD20+ lymphoma cells (red), and normal mouse immune cells: mB220+ B cells (green), mCD4+ T cells (yellow), and mCD8+ T cells (blue) within TDLN. (F) Flow cytometry quantification of infiltrating 38c13-hCD20 cells within the TDLN. Results are the mean percentage of hCD20+ cells within the CD45+ population ± SD of 5 TDLN/treatment group. (G) Representative TDLN IHC for hCD20+ cells (brown) confirming αCD20-EndoP125A reduction of 38c13-hCD20 lymphoma infiltration. (H) Representative flow cytometry of the spleen depicting hCD20+ cells (red) and B220 cells (green) within the CD45+ cell population (blue). (I) Flow cytometry quantification of percentage of infiltrating 38c13-hCD20 lymphoma cells within the spleen. Results are the mean percentage of hCD20+ cells within the CD45+ population ± SD of 5 spleens/treatment group. (J) Representative Spleen IHC for hCD20+ cells (brown) indicating αCD20-EndoP125A reduction of infiltrating 38c13-hCD20 lymphoma cells. p-value < 0.05 was considered statistically significant or marked ns for not significant. Indicated p-values are * < 0.05, ** < 0.01, *** < 0.001, and **** < 0.0001.
Figure 7
Figure 7
αCD20-EndoP125A significantly reduced extra-nodal lymphoma dissemination to the lung and brain: (A) Representative flow cytometry of the lung depicting hCD20+ cells (red) and B220+ cells (green) within the CD45+ cell population (blue). (B) Flow cytometry quantification of the percentage of infiltrating 38c13-hCD20 lymphoma cells within the lung. Results are the mean percentage of hCD20+ cells within the CD45+ population ± SD of 5 lungs/treatment group. (C) Representative IHC for hCD20+ cells (brown) indicating infiltrating 38c13-hCD20 lymphoma cells within the lung. (D) Representative flow cytometry of brain depicting hCD20+ cells (red) and B220+ cells (green) within the CD45+ cell population (blue). (E) Flow cytometry quantification of the percentage of infiltrating 38c13-hCD20 lymphoma cells within the brain. Results are the mean percentage of hCD20+ cells within the CD45+ population ± SD of 5 brains/treatment group. (F) Representative IHC for hCD20+ cells (brown) indicating infiltrating 38c13-hCD20 lymphoma cells within the brain. p-value < 0.05 was considered statistically significant or marked ns for not significant. Indicated p-values are * < 0.05, ** < 0.01, *** < 0.001, and **** < 0.0001.
Figure 8
Figure 8
Schematic of αCD20-EndoP125A inhibition of vasculogenesis, lymphoma vessel co-option, and dissemination: αCD20-EndoP125A binds to lymphoma cells via the αCD20 and EndoP125A domains and binds to endothelial cells via the EndoP125A domain. αCD20-EndoP125A binding inhibits endothelial cell migration needed for angiogenesis and lymphangiogenesis and lymphoma cell motility and migration, preventing lymphoma vessel co-option. αCD20-EndoP125A suppression of CXCL12 and CXCR4 expression by both endothelial and lymphoma cells contributes to the inhibition of vessel formation and prevention of lymphoma interaction with vessels. In vivo treatment with αCD20-EndoP125A markedly reduced CD34+ tumor vasculature and LyVE-1+ tumor lymphatics, thereby decreasing lymphoma growth and dissemination.

Similar articles

References

    1. Jiang L., Li N. B-cell non-Hodgkin lymphoma: Importance of angiogenesis and antiangiogenic therapy. Angiogenesis. 2020;23:515–529. doi: 10.1007/s10456-020-09729-7. - DOI - PubMed
    1. Armitage J.O., Longo D.L. Mantle-Cell Lymphoma. N. Engl. J. Med. 2022;386:2495–2506. doi: 10.1056/NEJMra2202672. - DOI - PubMed
    1. Shankland K.R., Armitage J.O., Hancock B.W. Non-Hodgkin lymphoma. Lancet. 2012;380:848–857. doi: 10.1016/S0140-6736(12)60605-9. - DOI - PubMed
    1. Ansell S.M. Non-Hodgkin Lymphoma: Diagnosis and Treatment. Mayo Clin. Proc. 2015;90:1152–1163. doi: 10.1016/j.mayocp.2015.04.025. - DOI - PubMed
    1. Green K., Munakomi S., Hogg J.P. Central Nervous System Lymphoma. StatPearls; Treasure Island, FL, USA: 2024. - PubMed

Publication types

MeSH terms

Substances

LinkOut - more resources