. 2024 Nov 20;13(22):1926.
doi: 10.3390/cells13221926.

Distinct Molecular Profiles Underpin Mild-To-Moderate Equine Asthma Cytological Profiles

Affiliations

Distinct Molecular Profiles Underpin Mild-To-Moderate Equine Asthma Cytological Profiles

Anna E Karagianni et al. Cells. .

Abstract

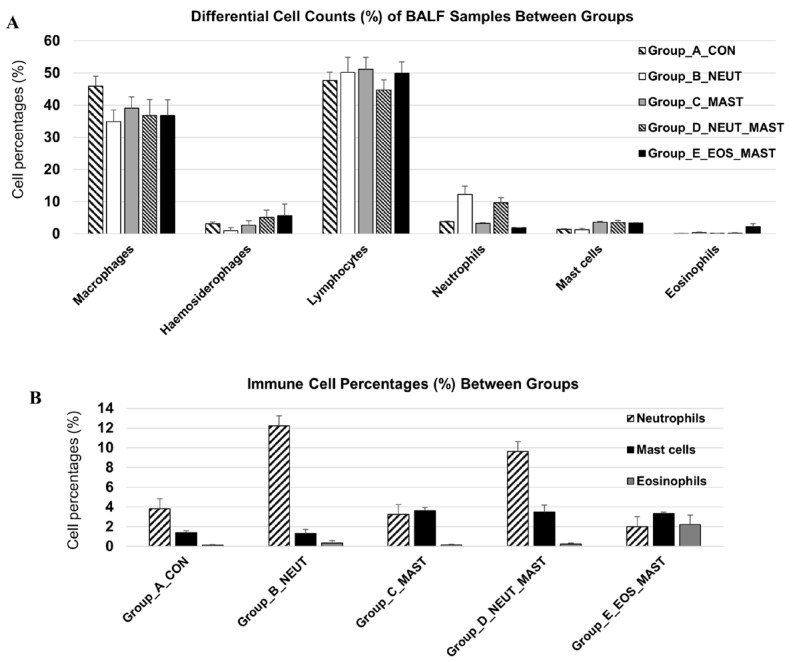
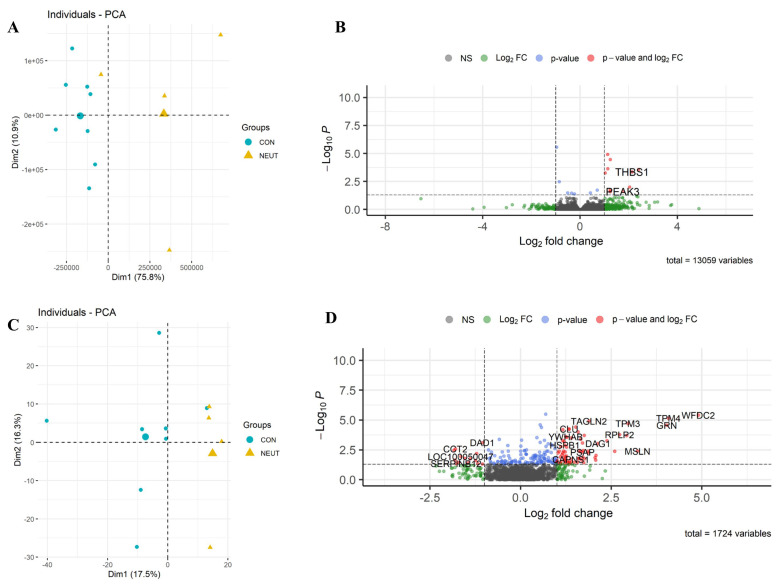
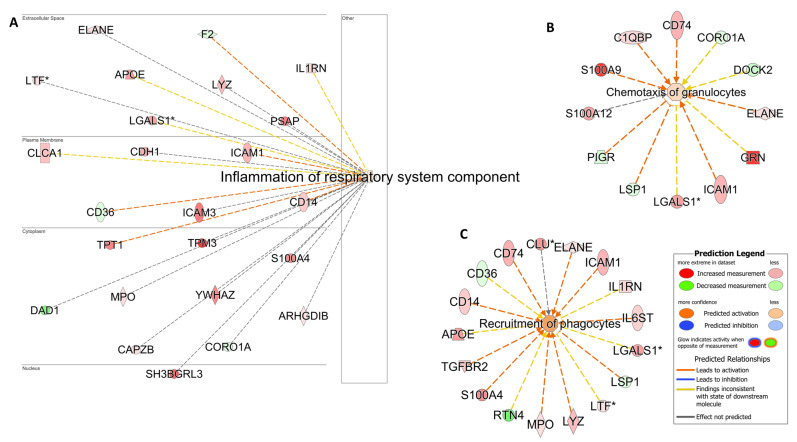
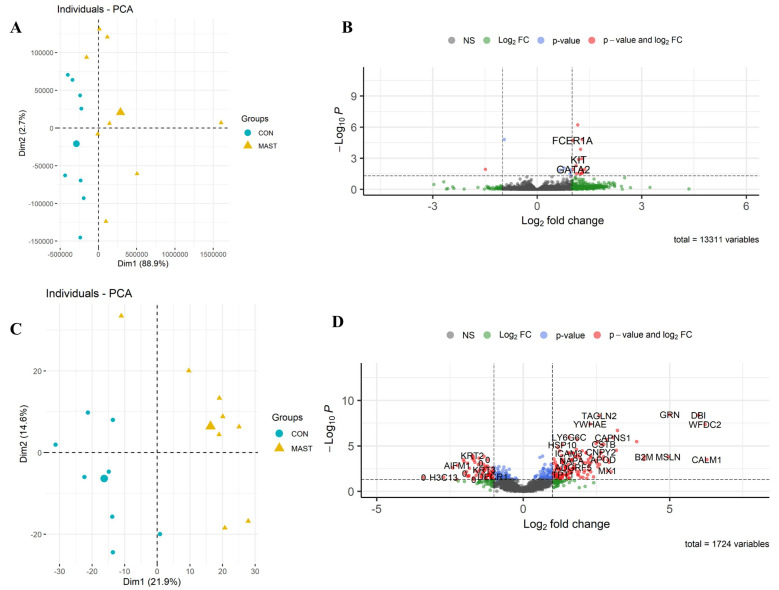
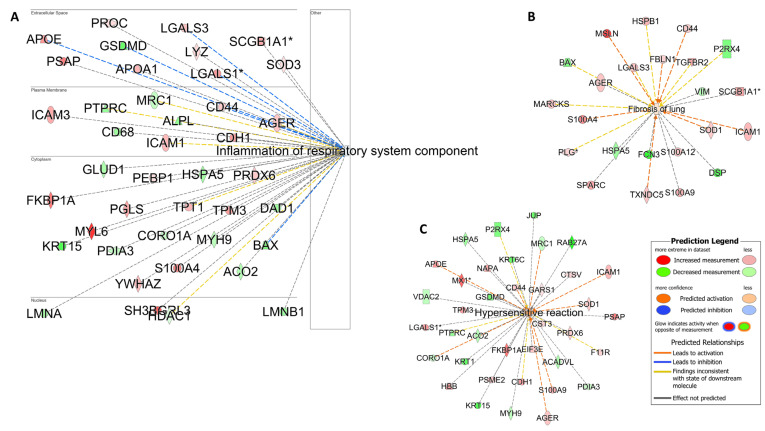
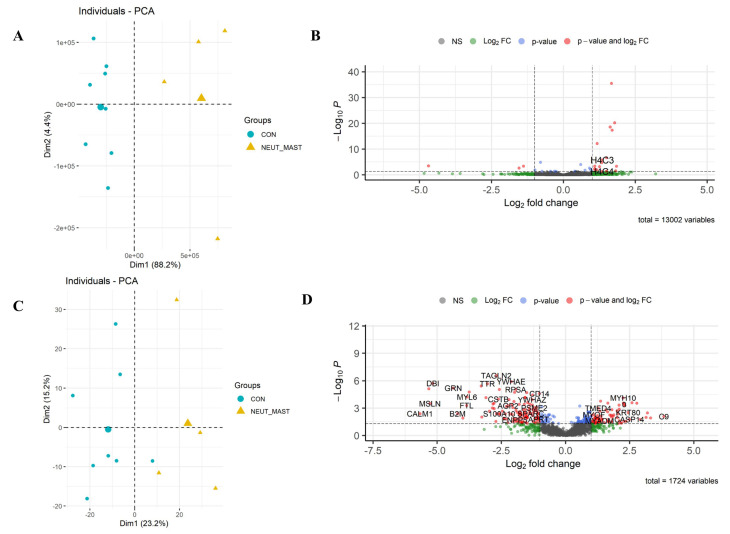
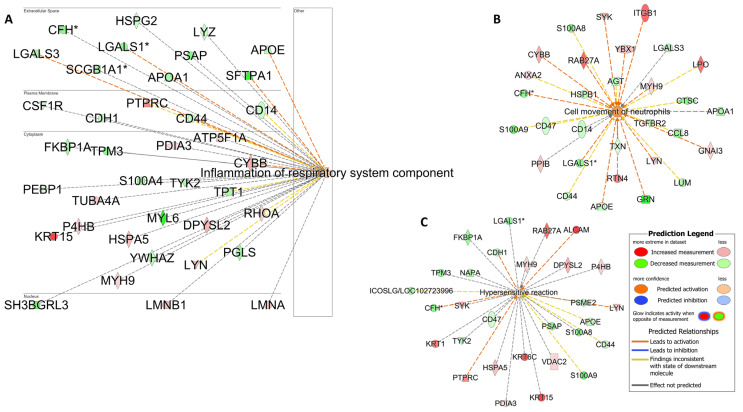
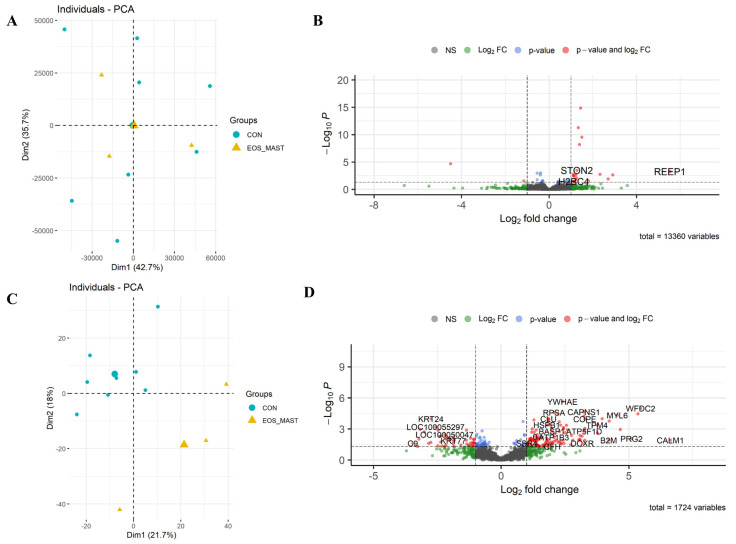
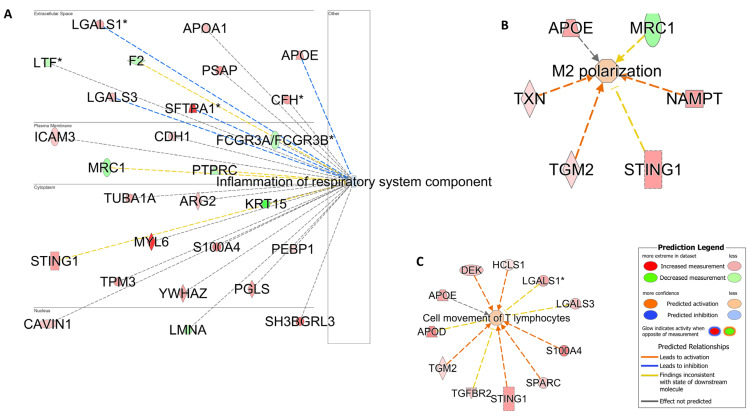
A state-of-the-art multi-omics approach was applied to improve our understanding of the aetio-pathogenesis of a highly prevalent, performance-limiting disorder of racehorses: mild-to-moderate equine asthma (MMEA). This is a prerequisite to improving prophylactic, management, and therapeutic options for this condition. Although a number of risk factors have been identified, options for intervention are limited. This study applied a multi-omic approach to reveal key inflammatory pathways involved in inflammatory cell recruitment to the lower airways and highlight distinct MMEA inflammatory profiles. We compared bronchoalveolar lavage fluid (BALF) cell gene and protein expression data from horses with non-inflammatory BALF cytology with those isolated from horses with neutrophilic, mastocytic, mixed neutrophilic/mastocytic, and eosinophilic/mastocytic inflammation. The analyses on transcriptomic/proteomic data derived from BALF from horses with neutrophilic cytology showed enrichment in classical inflammatory pathways, and horses with mastocytic inflammation showed enrichment in pathways involved in hypersensitivity reactions related to nonclassical inflammation potentially mimicking a Th2-immune response. The mixed eosinophilic/mastocytic group also presented with a nonclassical inflammatory profile, whereas the mixed neutrophilic/mastocytic group revealed profiles consistent with both neutrophilic inflammation and hypersensitivity. Our adopted multi-omics approach provided a holistic assessment of the immunological status of the lower airways associated with the different cytological profiles of equine asthma.

Keywords: airway immunity; asthma; bronchoalveolar lavage; equine; proteomic; transcriptomic.


Conflict of interest statement

None of the co-authors have any conflict of interest.

Figures

Figure 1
Figure 1
Bronchoalveolar lavage fluid cytological profile. Differential cell count (mean + SEM%) of equine BALF samples (n = 27) between the different groups (A) and the percentages of inflammatory cells of interest only (neutrophils, mast cells, and eosinophils) (B). Differential leucocyte count (minimum of 300 cells) was performed and expressed as a percentage of the total nonsquamous and non-epithelial nucleated cells.
Figure 2
Figure 2
Total protein stain from the equine bronchoalveolar lavage samples. Lane 1 shows the protein ladder. Total protein stain of the equine BALF samples (Lanes 2–12, 5 µg). Note the diversity of proteins in the BALF samples. The stained gel was imaged using the LICOR Odyssey imager and the associated Image Studio Software, Version 5.2.
Figure 3
Figure 3
Differential expression of Group_B_NEUT. Scatterplot of the first two principal components (Dim1 and Dim2) of the RNA-seq (A) and proteomic samples (C) clustered according to their gene and protein expression; in parenthesis: original variance explained by each principal component. The larger symbols represent group means. Volcano plots of differentially expressed genes (B) and proteins (D), identified between Group_B_NEUT (NEUT) and the control group (CON). The green dots denote molecules with an absolute log2-fold change of >1. The blue dots denote genes with FDR ≤ 0.05, and the red dots denote those with FDR ≤ 0.05 and an absolute log2-fold change of >1 (B). In the proteomic dataset, the blue dots denote those with a p-value of ≤0.05, and the red dots denote those with a p-value of ≤0.05 and an absolute log2-fold change of >1 (D). Finally, the grey dots denote gene/protein expression without marked differences.
Figure 4
Figure 4
Airway inflammation and phagocyte cell activation. Pathway analysis identifies networks comprising airway inflammation (A), Chemotaxis of granulocytes (B) and (C) Recruitment of phagocytes. The biological processes and regulators are colored by their predicted activation state: activated (orange) or inhibited (blue). Darker colors indicate higher scores. The edges connecting the nodes are colored orange when leading to the activation of the downstream node, blue when leading to its inhibition, and yellow if the findings underlying the relationship are inconsistent with the state of the downstream node. The pointed arrowheads indicate that the downstream node is expected to be activated if the upstream node connected to it is activated, whereas the blunt arrowheads indicate that the downstream node is expected to be inhibited if the upstream node that connects to it is activated. The molecules in green are downregulated, and those in red are upregulated. The asterisk (*) indicates that multiple identifiers map to the molecule. The analysis was performed using the Ingenuity Pathway Analysis software v24.0.1.
Figure 5
Figure 5
Differential expression of Group_C_MAST. Scatterplot of the first two principal components (Dim1 and Dim2) of the RNA-seq (A) and proteomic samples (C) clustered according to their gene and protein expression; in parenthesis: the original variance explained by each principal component. The larger symbols represent group means. Volcano plots of differentially expressed genes (B) and proteins (D), identified between Group_C_MAST (MAST) and the control group (CON). The green dots denote molecules with an absolute log2-fold change of >1. The blue dots denote genes with an FDR of ≤0.05, and the red dots denote those with an FDR of ≤0.05 and an absolute log2-fold change of >1 (B). In the proteomic dataset, the blue dots denote those with a p-value of ≤0.05, and the red dots those with a p-value of ≤0.05 and an absolute log2-fold change of >1 (D). Finally, the grey dots denote the gene/protein expression without marked differences.
Figure 6
Figure 6
Hypersensitivity and fibrosis. Pathway analysis identifies networks comprising airway inflammation (A). Fibrotic processes (B) and hypersensitivity reactions (C) were also enriched in racehorses with high mast cell counts. The biological processes and regulators are colored according to their predicted activation state: activated (orange) or inhibited (blue). The darker colors indicate higher scores. The edges connecting the nodes are colored orange when leading to the activation of the downstream node, blue when leading to its inhibition, and yellow if the findings underlying the relationship are inconsistent with the state of the downstream node. The pointed arrowheads indicate that the downstream node is expected to be activated if the upstream node connected to it is activated, whereas the blunt arrowheads indicate that the downstream node is expected to be inhibited if the upstream node that connects to it is activated. The molecules in green are downregulated, and those in red are upregulated. The asterisk (*) indicates that multiple identifiers map to the molecule. The analysis was performed using the Ingenuity Pathway Analysis software v24.0.1.
Figure 7
Figure 7
Differential expression of Group_D_NEUT_MAST. Scatterplot of the first two principal components (Dim1 and Dim2) of the RNA-seq (A) and proteomic samples (C), clustered according to their gene and protein expression; in parenthesis: the original variance explained by each principal component. The larger symbols represent group means. Volcano plots of the differentially expressed genes (B) and proteins (D) identified between Group_D_NEUT_MAST and the control group. The green dots denote molecules with an absolute log2-fold change of >1. The blue dots denote genes with an FDR of ≤0.05, and the red dots those with an FDR of ≤0.05 and an absolute log2-fold change of >1 (B). In the proteomic dataset, the blue dots denote those with a p-value of ≤0.05, and the red dots those with a p-value of ≤0.05 and an absolute log2-fold change of >1 (D). Finally, the grey dots denote the gene/protein expression without marked differences.
Figure 8
Figure 8
Airway inflammation and hypersensitivity reaction. Pathway analysis is used to identify networks comprising airway inflammation (A). Neutrophil migration (B) and hypersensitivity reactions (C) were also enriched in racehorses with high neutrophil and mast cell counts. The biological processes and regulators are colored by their predicted activation state: activated (orange) or inhibited (blue). The darker colors indicate higher scores. The edges connecting the nodes are colored orange when leading to the activation of the downstream node, blue when leading to its inhibition, and yellow if the findings underlying the relationship are inconsistent with the state of the downstream node. The pointed arrowheads indicate that the downstream node is expected to be activated if the upstream node connected to it is activated, whereas the blunt arrowheads indicate that the downstream node is expected to be inhibited if the upstream node that connects to it is activated. The molecules in green are downregulated, and those in red are upregulated. The asterisk (*) indicates that multiple identifiers map to the molecule. Analysis was performed using the Ingenuity Pathway Analysis software v24.0.1.
Figure 9
Figure 9
Differential expression of Group_E_EOS_MAST. Scatterplot of the first two principal components (Dim1 and Dim2) of the RNA-seq (A) and proteomic samples (C), clustered according to their gene and protein expression; in parenthesis: the original variance explained by each principal component. The larger symbols represent group means. Volcano plots of differentially expressed genes (B) and proteins (D), identified between Group_E_EOS_MAST and the control group. The green dots denote molecules with an absolute log2-fold change of >1. The blue dots denote genes with an FDR of ≤0.05, and the red dots those with an FDR of ≤0.05 and an absolute log2-fold change of >1 (B). In the proteomic dataset, the blue dots denote those with a p-value of ≤0.05, and the red dots those with a p-value of ≤0.05 and an absolute log2-fold change > 1 (D). Finally, the grey dots denote the gene/protein expression without marked differences.
Figure 10
Figure 10
Alternative inflammation profile. Pathway analysis is used to identify networks indicating the inhibition of airway inflammation (A), the activation of alternative macrophage polarization (M2) (B), and T cell movement (C). The biological processes and regulators are colored by their predicted activation state: activated (orange) or inhibited (blue). The darker colors indicate higher scores. The edges connecting the nodes are colored orange when leading to the activation of the downstream node, blue when leading to its inhibition, and yellow if the findings underlying the relationship are inconsistent with the state of the downstream node. The pointed arrowheads indicate that the downstream node is expected to be activated if the upstream node connected to it is activated, whereas the blunt arrowheads indicate that the downstream node is expected to be inhibited if the upstream node that connects to it is activated. The molecules in green are downregulated, and those in red are upregulated. The asterisk (*) indicates that multiple identifiers map to the molecule. The analysis was performed using the Ingenuity Pathway Analysis software v24.0.1.

Similar articles

References

    1. Wood J.L.N., Newton J.R., Chanter N., Mumford J.A. Inflammatory airway disease, nasal discharge and respiratory infections in young British racehorses. Equine Vet. J. 2005;37:236–242. doi: 10.2746/0425164054530579. - DOI - PubMed
    1. Allen K.J., Tremaine W.H., Franklin S.H. Prevalence of inflammatory airway disease in national hunt horses referred for investigation of poor athletic performance. Equine Vet. J. Suppl. 2006;38:529–534. doi: 10.1111/j.2042-3306.2006.tb05599.x. - DOI - PubMed
    1. Ivester K.M., Couetil L.L., Moore G.E. An observational study of environmental exposures, airway cytology, and performance in racing thoroughbreds. J. Vet. Intern. Med. 2018;32:1754–1762. doi: 10.1111/jvim.15226. - DOI - PMC - PubMed
    1. Couetil L., Cardwell J.M., Leguillette R., Mazan M., Richard E., Bienzle D., Bullone M., Gerber V., Ivester K., Lavoie J.P., et al. Equine Asthma: Current Understanding and Future Directions. Front. Vet. Sci. 2020;7:450. doi: 10.3389/fvets.2020.00450. - DOI - PMC - PubMed
    1. Davis K.U., Sheats M.K. Differential gene expression and Ingenuity Pathway Analysis of bronchoalveolar lavage cells from horses with mild/moderate neutrophilic or mastocytic inflammation on BAL cytology. Vet. Immunol. Immunopathol. 2021;234:110195. doi: 10.1016/j.vetimm.2021.110195. - DOI - PMC - PubMed

Publication types

Associated data