. 2024 Nov 6;16(22):3748.
doi: 10.3390/cancers16223748.

Exploring Extracellular Vesicle Surface Protein Markers Produced by Glioblastoma Tumors: A Characterization Study Using In Vitro 3D Patient-Derived Cultures

Affiliations

Exploring Extracellular Vesicle Surface Protein Markers Produced by Glioblastoma Tumors: A Characterization Study Using In Vitro 3D Patient-Derived Cultures

Sara Franceschi et al. Cancers (Basel). .

Abstract

Background/objectives: Glioblastoma (GBM) is an aggressive brain cancer with limited treatment options. Extracellular vesicles (EVs) derived from GBM cells contain important biomarkers, such as microRNAs, proteins, and DNA mutations, which are involved in tumor progression, invasion, and resistance to treatment. Identifying surface markers on these EVs is crucial for their isolation and potential use in noninvasive diagnosis. This study aimed to use tumor-derived explants to investigate the surface markers of EVs and explore their role as diagnostic biomarkers for GBM.

Methods: Tumor explants from nine GBM patients without IDH1/IDH2 mutations or 1p-19q co-deletion were cultured to preserve both tumor viability and cytoarchitecture. EVs were collected from the tumor microenvironment using differential centrifugation, filtration, and membrane affinity binding. Their surface protein composition was analyzed through multiplex protein assays. RNA-Seq data from TCGA and GTEx datasets, along with in silico single-cell RNA-seq data, were used to assess EV surface biomarker expression across large GBM patient cohorts.

Results: The in vitro model successfully replicated the tumor microenvironment and produced EVs with distinct surface markers. Biomarker analysis in large datasets revealed specific expression patterns unique to GBM patients compared with healthy controls. These markers demonstrated potential as a GBM-specific signature and were correlated with clinical data. Furthermore, in silico single-cell RNA-seq provided detailed insights into biomarker distribution across different cell types within the tumor.

Conclusions: This study underscores the efficacy of the tumor-derived explant model and its potential to advance the understanding of GBM biology and EV production. A key innovation is the isolation of EVs from a model that faithfully mimics the tumor's original cytoarchitecture, offering a deeper understanding of the cells involved in EV release. The identified EV surface markers represent promising targets for enhancing EV isolation and optimizing their use as diagnostic tools. Moreover, further investigation into their molecular cargo may provide crucial insights into tumor characteristics and evolution.

Keywords: extracellular vesicles; glioblastoma; surface markers; tumor microenvironment; tumor-derived explants.


Conflict of interest statement

The authors declare no conflicts of interest.

Figures

Figure 1
Figure 1
Isolation and characterization of EVs produced by patient-derived tumors: (A) Outline of our experimental protocol illustrating the cultivation of patient-derived explants, physiological release of EVs into the culture medium, and subsequent isolation and characterization of these EVs for further investigation. (B) Immunohistochemical staining of a tumor-derived explant section after one week of culture. H&E, hematoxylin and eosin staining; Ki67, nuclear marker for proliferating cells; GFAP, astrocyte glial fibrillary acidic protein staining; IBA1, ionized calcium-binding adapter molecule 1 staining of tumor-associated microglia/macrophages. (C) Western blot analysis of exosomal marker CD63 and β-tubulin expression in EVs isolated from patient-derived tumor culture medium.
Figure 2
Figure 2
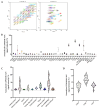
Flow cytometry analysis of EVs membrane markers using the MACSplex kit: (A) The left panel illustrates the gating strategy employed to differentiate between distinct bead populations labeled with various markers. The right panel displays the signal intensity measurements of individual bead populations, enabling the characterization of EV membrane markers. (B) Overview of the total expression profile for 39 surface markers on EVs isolated from GBM cultures. Data are presented as normalized and background-subtracted median CD9/CD63/CD81 fluorescence intensity (MFI) (isotype control and blank samples). (C) Expression profile of the 10 proteins of the 37 analyzed that showed positive signals (higher MFIs compared with the respective isotype controls) in all tumor samples. (D) Expression profile of the three tetraspanins (CD9, CD63, and CD81) present on the surface of the GBM-derived EVs under investigation.
Figure 3
Figure 3
EVs Membrane Biomarker Expression in GBM: (A) Expression matrix of EVs markers, with color density representing median expression values of genes in GBM (T) and control human cortex samples (N), normalized to the maximum median expression value. Log2(TPM + 1) was used for log scaling. (B) Box plots with jitter comparing expression in GBM samples (blue box) expression in comparison to control tissue (green box). Log2FC cutoff: 1 and p-value cutoff: 0.01 were used for differential thresholds. One-way ANOVA was employed for differential analysis. (C) Principal component analysis of the nine EVs markers based on GBM (blue dots) and controls (green dots) expression data, presented in a 3D plot of the first three principal components. Analyses were conducted using the GEPIA2 tool, which utilizes data from The Cancer Genome Atlas (TCGA) for the expression analysis of 163 GBM samples and the Genotype-Tissue Expression (GTEx) database for comparison with the expression data from 207 control cortex samples.
Figure 4
Figure 4
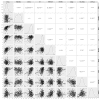
Correlation of biomarker expression. Correlation matrix of the expression of the 9 selected markers in 528 GBM samples. The distribution of variables is shown on the left, and Pearson correlation coefficients and significance level are shown on the right. X and Y labels correspond to the log-transformed values of the biomarkers. (*** p < 0.001; ** p < 0.01; * p < 0.05). Correlation analysis was conducted using the Gliovis portal, which utilizes data from The Cancer Genome Atlas (TCGA) for the expression analysis of 528 GBM samples.
Figure 5
Figure 5
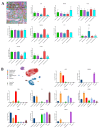
(A) Analysis of the nine EVs membrane marker expression in GBM tissue using RNA-seq of five isolated anatomical structures by laser microdissection: cellular tumor (red), infiltrating tumor (yellow), leading edge (green), microvascular proliferation (blue), and pseudopalisading cells around necrosis (purple). The analysis and graphical visualization of the data were conducted utilizing GlioVis portal. (B) Analysis of the expression of nine EVs membrane markers in GBM tissue using RNA-seq of single cells from seven distinct cell types, each representing a separate cluster: neoplastic cells (blue), vascular cells (orange), myeloid cells (red), neurons (green), oligodendrocytes (light blue), oligodendrocyte progenitor cells (OPCs, purple) and astrocytes (brown). The analysis and graphical visualization of the data were conducted utilizing the user-friendly web interface provided by the gbmseq.org platform. Statistically significant differences were highlighted only for the group displaying significant overexpression or downregulation compared with other groups for each gene, using an unpaired t-test. Significance levels are denoted as follows: * = p ≤ 0.05; ** = p ≤ 0.01; **** = p ≤ 0.0001.

References

    1. Rong L., Li N., Zhang Z. Emerging therapies for glioblastoma: Current state and future directions. J. Exp. Clin. Cancer Res. 2022;41:142. doi: 10.1186/s13046-022-02349-7. - DOI - PMC - PubMed
    1. Czystowska-Kuzmicz M., Whiteside T.L. The potential role of tumor-derived exosomes in diagnosis, prognosis, and response to therapy in cancer. Expert Opin. Biol. Ther. 2021;21:241–258. doi: 10.1080/14712598.2020.1813276. - DOI - PMC - PubMed
    1. Skouras P., Gargalionis A.N., Piperi C. Exosomes as Novel Diagnostic Biomarkers and Therapeutic Tools in Gliomas. Int. J. Mol. Sci. 2023;24:10162. doi: 10.3390/ijms241210162. - DOI - PMC - PubMed
    1. Nikolova E., Laleva L., Milev M., Spiriev T., Stoyanov S., Ferdinandov D., Mitev V., Todorova A. miRNAs and related genetic biomarkers according to the WHO glioma classification: From diagnosis to future therapeutic targets. Non-Coding RNA Res. 2023;9:141–152. doi: 10.1016/j.ncrna.2023.10.003. - DOI - PMC - PubMed
    1. Makowska M., Smolarz B., Romanowicz H. microRNAs (miRNAs) in Glioblastoma Multiforme (GBM)-Recent Literature Review. Int. J. Mol. Sci. 2023;24:3521. doi: 10.3390/ijms24043521. - DOI - PMC - PubMed

LinkOut - more resources