. 2024 Nov 6;16(22):3752.
doi: 10.3390/cancers16223752.

HDAC6 as a Prognostic Factor and Druggable Target in HER2-Positive Breast Cancer

Affiliations

HDAC6 as a Prognostic Factor and Druggable Target in HER2-Positive Breast Cancer

Michela Cortesi et al. Cancers (Basel). .

Abstract

Background: Adjuvant trastuzumab is the standard of care for HER2+ breast cancer (BC) patients. However, >50% of patients become resistant. This study aimed at the identification of the molecular factors associated with disease relapse and their further investigation as therapeutically exploitable targets.

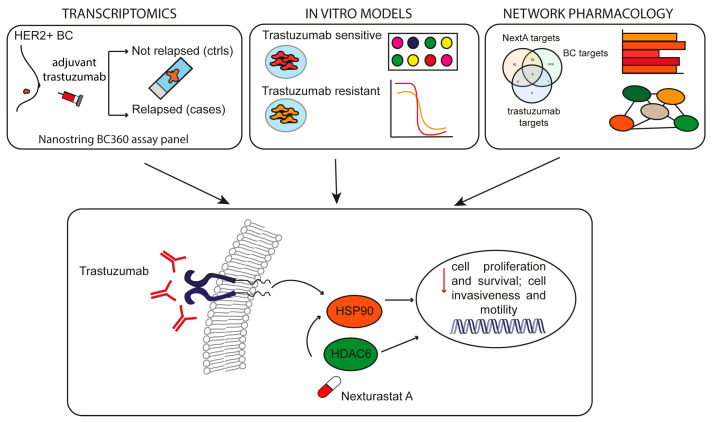
Methods: Analyses were conducted on formalin-fixed paraffin-embedded tissues of the primary tumors of relapsed (cases) and not relapsed (controls) HER2+ BC patients treated with adjuvant trastuzumab. The nCounter Human Breast Cancer Panel 360 was used. Logistic regression and partitioning around medoids were employed to identify the genes associated with disease recurrence. Cytotoxicity experiments using trastuzumab-resistant cell lines and a network pharmacology approach were carried out to investigate drug efficacy.

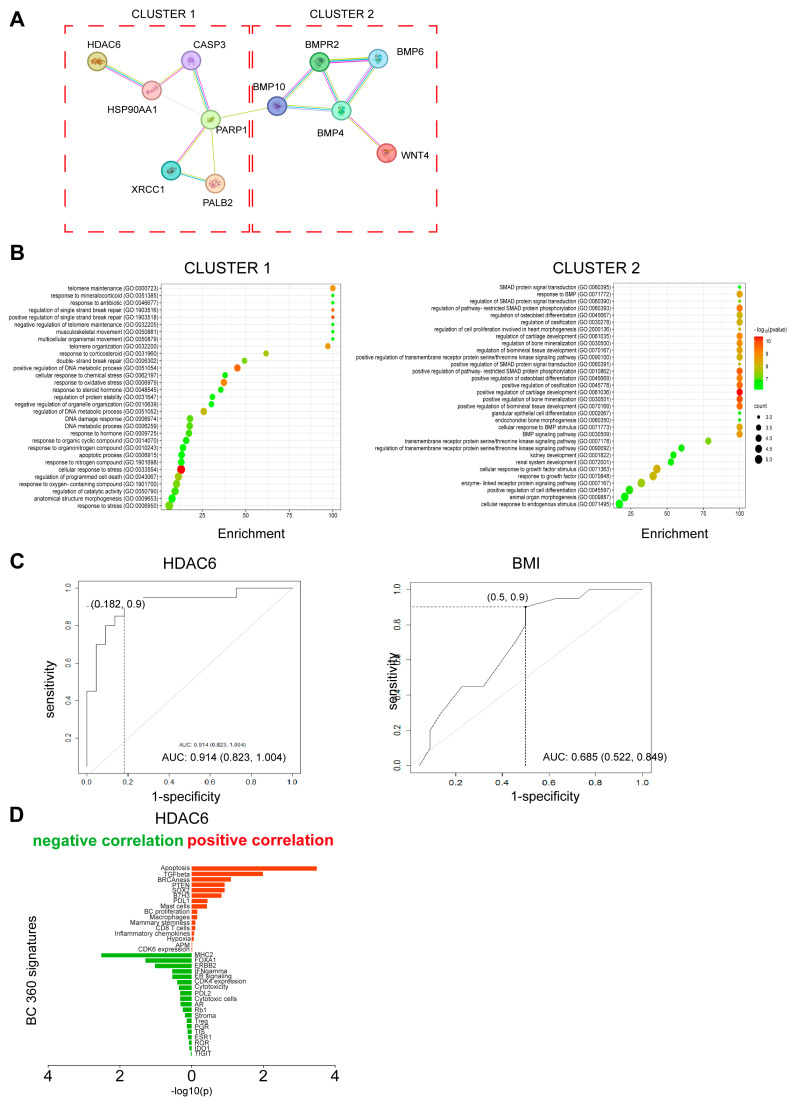
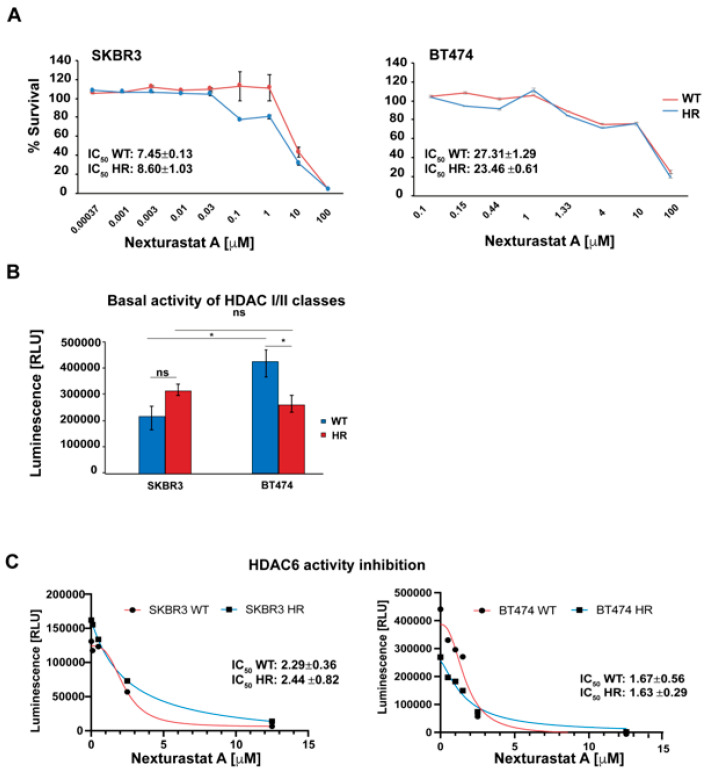
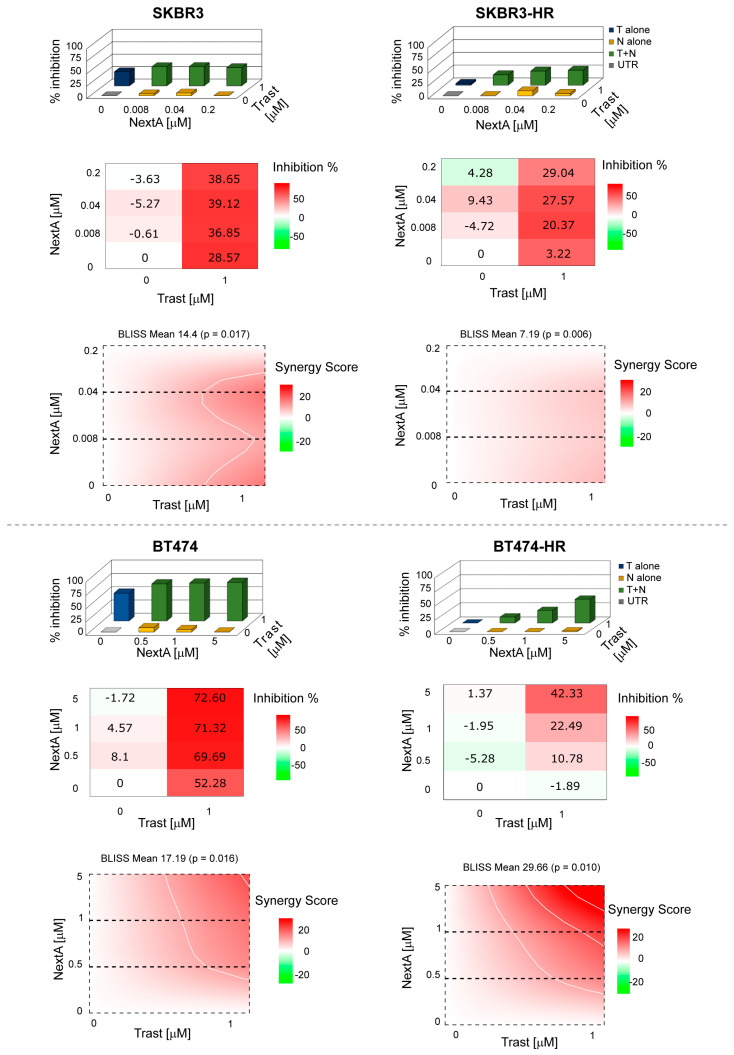
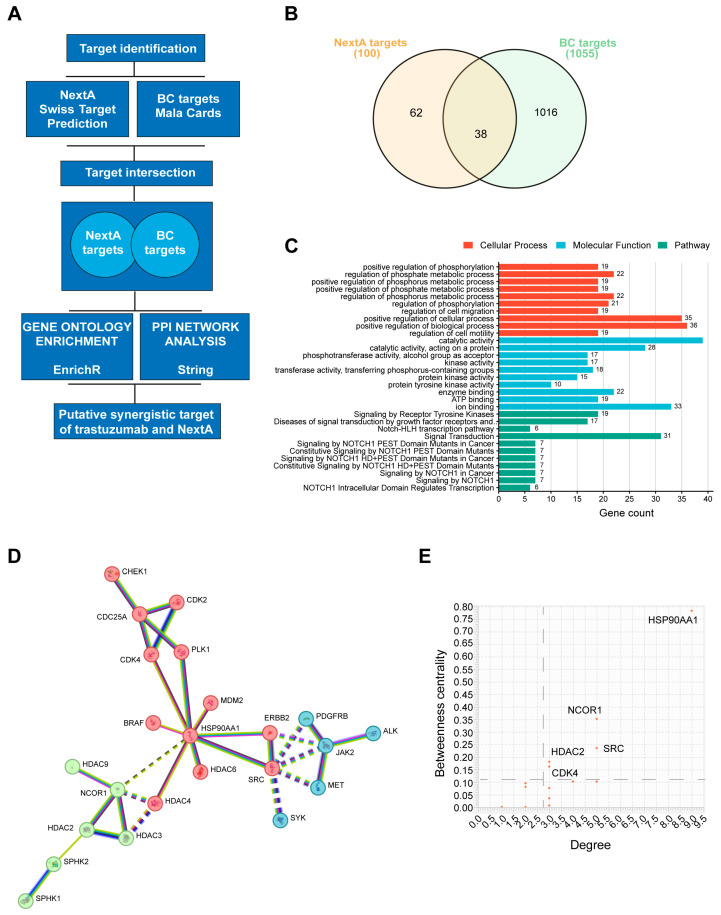
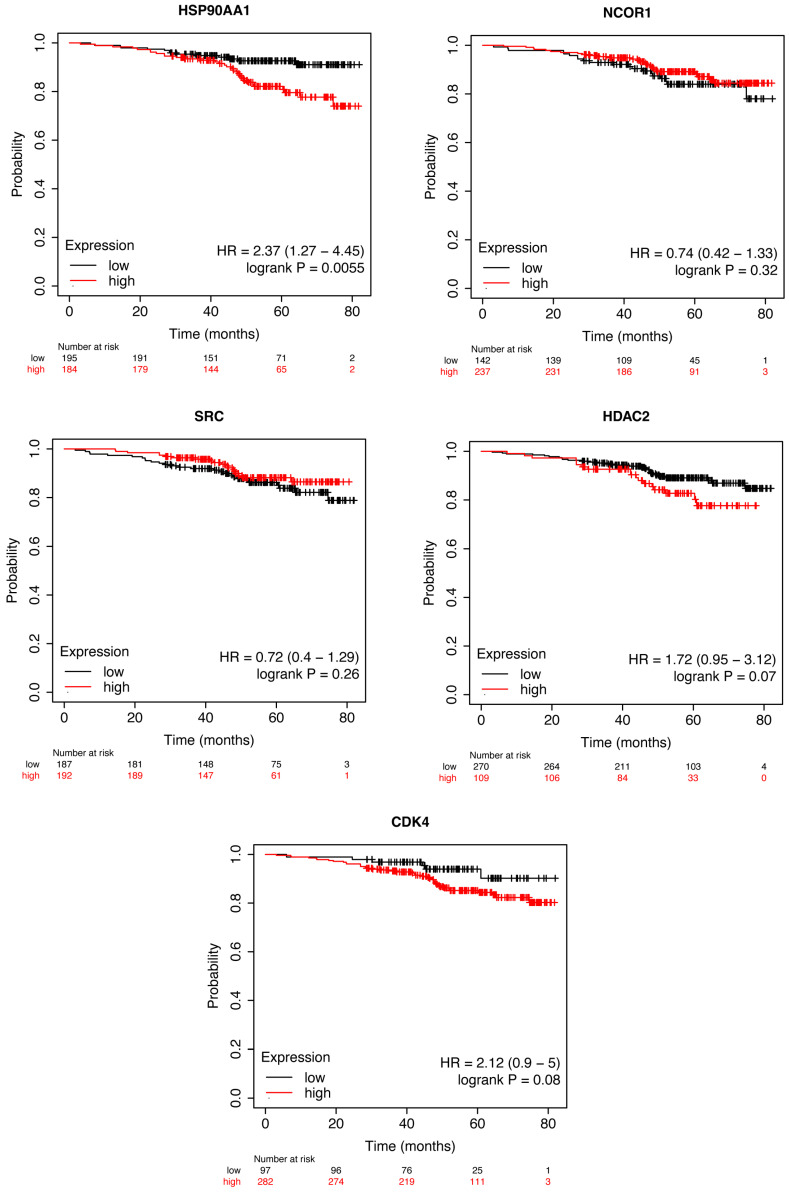
Results: A total of 52 patients (26 relapsed and 26 not relapsed) were analyzed. We found that a higher expression of HDAC6 was significantly associated with an increased risk of recurrence, with an adjusted OR of 3.20 (95% CI 1.38-9.91, p = 0.016). Then, we investigated the cytotoxic activity of the selective HDAC6 inhibitor Nexturastat A (NextA) on HER2+ cell lines, which were both sensitive and trastuzumab-resistant. A sub-cytotoxic concentration of NextA, combined with trastuzumab, showed a synergistic effect on BC cell lines. Finally, using a network pharmacology approach, we identified HSP90AA1 as the putative molecular candidate responsible for the synergism observed in vitro.

Conclusions: Our findings encourage the exploration of the role of HDAC6 as a prognostic factor and the combinatorial use of HDAC6 selective inhibitors combined with trastuzumab in HER2+ BC, in particular for those patients experiencing drug resistance.

Keywords: HDAC6; HER2 positive; adjuvant treatment; breast cancer; resistance; trastuzumab.


Conflict of interest statement

The authors declare no conflicts of interest.

Figures

Figure 1
Figure 1
Identification of prognostic markers. (A) Protein–protein interaction (PPI) network of the five medoids based on STRING database. The network nodes are proteins. The edges represent the predicted and known protein–protein associations. Different colored edges represent different associations. Light blue: experimental evidence from the database; purple: experimentally determined; yellow: text mining evidence; indigo: protein homology. (B) Enrichment bubble plot describing the pathways enriched within clusters 1 and 2. Cluster 1 is composed of 6 genes (HDAC6, PALB2, PARP1, XRCC1, CASP3, and HSP90AA1). Cluster 2 is composed of 5 genes (BMP10, BMPR2, BMP4, BMP6, and WNT4). Information on pathway enrichment was retrieved using GO enrichment analysis tools (https://geneontology.org accessed on 6 November 2023). The color scale indicates different thresholds of the p-value, and the size of the dot indicates the number of genes corresponding to each pathway. Bubble plots were obtained using the online free tool SRplot [38]. (C) ROC curve for prediction of disease relapse based on HDAC6 gene expression and on BMI. Curve from the multivariable logistic model. Sensitivity and 1-specificity values were also reported in correspondence with the cutoff obtained by the Youden index. (D) Diagram showing the correlations between HDAC6 and BC360 signatures. Signatures positively correlated are shown in red, and signatures negatively regulated are shown in green. The asterisks indicate the most significant correlation based on p-value and R score (−0.4 ≥ R score ≥ 0.4).
Figure 2
Figure 2
Kaplan–Meier curve for DFS in patients with HER2 + BC treated with adjuvant trastuzumab stratified by median HDAC6 expression value.
Figure 3
Figure 3
Generation of trastuzumab-resistant subclones. (A) HDAC6 and ERBB2 relative gene expression analysis performed by quantitative real-time RT-PCR. Expression levels in both genes were normalized to GAPDH, HPRT-1, and ACTB. The bars show RQ ± standard deviation (SD). * p < 0.05; ** p < 0.01. (B) Clonogenic assay. BC cell lines, both WT and HR, were treated with trastuzumab at concentrations of 200 mg/mL and 400 mg/mL for two weeks. Survival fractions were obtained by counting colonies with more than 50 cells by inverted microscope (n = 12 for each time point, mean ± SD; ns: not significant). (C) Cell doubling time (DT). BC cell lines (WT and HR) were counted every day until confluence. Population doubling time was calculated using the formula log2 (Cv/Cs). n = 3 for time point mean ± SD). (D) Left panel: representative images of IHC staining for HDAC6 and HER2 of WT and HR cell lines. Images magnification 20×. Right panel: relative gene expression analysis performed by quantitative real-time RT-PCR. Expression levels of HDAC6 and ERBB2 were normalized to GAPDH, HPRT-1, and ACTB. The bars show fold change ± standard deviation (SD) ns: not significant.
Figure 4
Figure 4
HDAC6 activity in BC cells. (A) NextA cytotoxic activity. BC cells were treated with NextA at concentrations ranging from 0.37 nM to 100 μM for 72 h. n = 3, mean ± SD. Cell viability was measured using MTS CellTiter96® Aqueous One Solution cell proliferation assay. (B) Whole HDAC classes I/II basal activity in both WT and HR BT474 and SKBR3 cell lines, * p < 0.05, ns: not significant; (C) WT and HR cells were treated with Nexturastat A at concentrations ranging between 0.008 μM and 12.5 μM. HDAC class I/II activity was measured using HDAC-GloTM class I/II assay.
Figure 5
Figure 5
Drug combination evaluation. BC cells were treated with trastuzumab and NextA both alone and in combination. MTS CellTiter96® Aqueous One Solution cell proliferation assay was used to determine cell viability. The BLISS synergy score was evaluated using the SynergyFinder.org web application. Score < −10 antagonism, between −10 and 10 additivity, >10 synergism.
Figure 6
Figure 6
Network pharmacology. (A) Outline of the tools used for the study. (B) Venn diagram represents the intersection of BC-associated genes and NextA targets. (C) Bar plot showing most significant cellular processes, molecular functions, and pathways enriched with NextA and BC-associated common genes. (D) PPI network map of trastuzumab and NextA targets against BC targets. The unsupervised clustering method, k-means clustering, was applied to identify the clusters. (E) Graph showing the most relevant targets of the PPI network identified by degree and betweenness centrality.
Figure 7
Figure 7
Kaplan–Meier curves for OS in patients with HER2 + BC stratified HSP90AA1, NCOR1, SRC, HDAC2, and CDK4 expression values.
Figure 8
Figure 8
Graphical abstract. Using transcriptomics, in vitro models, and network pharmacology, we found that trastuzumab synergizes with the HDAC6-specific inhibitor NexturastatA, probably through the modulation of HSP90, leading to cell death and inhibition of cell proliferation of HER2+ BC cells that are both sensitive and resistant to trastuzumab.

References

    1. Siegel R.L., Miller K.D., Jemal A. Cancer statistics, 2020. CA Cancer J. Clin. 2020;70:7–30. doi: 10.3322/caac.21590. - DOI - PubMed
    1. Cronin K.A., Harlan L.C., Dodd K.W., Abrams J.S., Ballard-Barbash R. Population-based estimate of the prevalence of HER-2 positive breast cancer tumors for early stage patients in the US. Cancer Investig. 2010;28:963–968. doi: 10.3109/07357907.2010.496759. - DOI - PMC - PubMed
    1. Prat A., Pineda E., Adamo B., Galván P., Fernández A., Gaba L., Díez M., Viladot M., Arance A., Muñoz M. Clinical implications of the intrinsic molecular subtypes of breast cancer. Breast. 2015;24:S26–S35. doi: 10.1016/j.breast.2015.07.008. - DOI - PubMed
    1. Ferrando-Díez A., Felip E., Pous A., Bergamino Sirven M., Margelí M. Targeted Therapeutic Options and Future Perspectives for HER2-Positive Breast Cancer. Cancers. 2022;14:3305. doi: 10.3390/cancers14143305. - DOI - PMC - PubMed
    1. Rocca A., Andreis D., Fedeli A., Maltoni R., Sarti S., Cecconetto L., Amadori D. Pharmacokinetics, pharmacodynamics and clinical efficacy of pertuzumab in breast cancer therapy. Expert Opin. Drug Metab. Toxicol. 2015;11:1647–1663. doi: 10.1517/17425255.2015.1078311. - DOI - PubMed

LinkOut - more resources