. 2024 Oct 31;14(11):1394.
doi: 10.3390/biom14111394.

Single-Cell RNA-Seq Analysis Links DNMT3B and PFKFB4 Transcriptional Profiles with Metastatic Traits in Hepatoblastoma

Affiliations

Single-Cell RNA-Seq Analysis Links DNMT3B and PFKFB4 Transcriptional Profiles with Metastatic Traits in Hepatoblastoma

Christophe Desterke et al. Biomolecules. .

Erratum in

Abstract

Hepatoblastoma is the most common primary liver cancer in children. Poor outcomes are primarily associated with patients who have distant metastases. Using the Mammalian Metabolic Enzyme Database, we investigated the overexpression of metabolic enzymes in hepatoblastoma tumors compared to noncancerous liver tissue in the GSE131329 transcriptome dataset. For the overexpressed enzymes, we applied ElasticNet machine learning to assess their predictive value for metastasis. A metabolic expression score was then computed from the significant enzymes and integrated into a clinical-biological logistic regression model. Forty-one overexpressed enzymes distinguished hepatoblastoma tumors from noncancerous liver tissues. Eighteen of these enzymes predicted metastasis status with an AUC of 0.90, demonstrating 85.7% sensitivity and 92.3% specificity. ElasticNet machine learning identified DNMT3B and PFKFB4 as key predictors of metastasis. Univariate analyses confirmed the significance of these enzymes, with respective p-values of 0.0058 and 0.0091. A metabolic score based on DNMT3B and PFKFB4 expression discriminated metastasis status and high-risk CHIC scores (p-value = 0.005). The metabolic score was more sensitive than the C1/C2 classifier in predicting metastasis (accuracy: 0.72 vs. 0.55). In a regression model integrating the metabolic score with epidemiological parameters (gender, age at diagnosis, histological type, and clinical PRETEXT stage), the metabolic score was confirmed as an independent adverse predictor of metastasis (p-value = 0.003, odds ratio: 2.12). This study identified the dual overexpression of PFKFB4 and DNMT3B in hepatoblastoma patients at risk of metastasis (high-risk CHIC classification). The combined tumor expression of DNMT3B and PFKFB4 was used to compute a metabolic score, which was validated as an independent predictor of metastatic status in hepatoblastoma.

Keywords: CHIC risk; DNA methylation; epigenetics; glycolysis; hepatoblastoma; metabolism; metastasis; transcriptome.


Conflict of interest statement

The authors declare no conflicts of interest.

Figures

Figure 1
Figure 1
The metabolic profile of hepatoblastoma tumors predicts distant metastasis status: dataset GSE131329. (A) Principal component analysis (PCA) was performed on the expression of the hepatoblastoma (HB) metabolic-41 program, which was subjected to tissue type stratification (noncancerous liver tissue vs. tumor), yielding a p-value on the first principal axis. (B) PCA was also performed on the expression of the HB metabolic-41 program, stratified by metastasis status, resulting in p-values on the first and third principal axes. (C) Unsupervised clustering (using Euclidean distances) and an expression heatmap of the 18 most informative metabolic markers in HB tumors (selected based on PCA axes for metastasis prediction) are presented. (D) The receiver operating characteristic (ROC) curve and the area under the curve (AUC) are also shown for the expression of these 18 markers used to predict metastasis status in hepatoblastoma tumors (Sens: sensitivity, Spe: specificity, PV+: positive predictive value, PV-: negative predictive value).
Figure 2
Figure 2
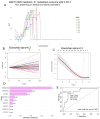
DNMT3B expression as a prognostic marker for metastasis in hepatoblastoma. We conducted ElasticNet tuning for the lambda and alpha parameters in the HB metabolic-41 expression program to predict metastasis status in tumors, utilizing an area under the curve (AUC) of 0.7/0.3 after splitting the data into training and validation cohorts. We obtained the following results: (A) the optimal ElasticNet tuning; (B) the ElasticNet fit with the best alpha parameter, fixed at 0.2; (C) the coefficient of variation of the ElasticNet with the best alpha parameter, fixed at 0.2; (D) a bar plot of the most predictive positive ElasticNet coefficients for metastasis, related to metabolic markers; and (E) the receiver operating characteristic (ROC) curve and area under the curve for predicting metastasis based on the combination of nine optimal ElasticNet metabolic markers: DNMT3B, PFKFB4, SOD3, NT5DC2, PKM, GSTP1, SOAT2, FKBP10, and PYCR1.
Figure 3
Figure 3
The combined expression of DNMT3B and PFKFB4 as a predictor of metastasis and CHIC risk stratification in hepatoblastoma tumor evaluation. (A) Univariate binomial analyses to identify the best metabolic markers in hepatoblastoma tumors based on metastasis status; (B) a boxplot of DNMT3B expression, stratified by metastatic status and colored according to CHIC risk stratification, with p-values determined by a two-tailed t-test; (C) a boxplot of PFKFB4 expression, stratified by metastatic status and colored according to CHIC risk stratification, with p-values determined by a two-sided t-test; (D) a boxplot of the metabolic/metastatic score (meta.score), which combines DNMT3B and PFKFB4 expression, stratified by metastasis status and colored according to CHIC risk stratification, with p-values determined by a two-sided t-test; (E) determination of the optimal cutpoint for meta.score to predict metastasis status; (F) a mosaic plot showing the relationship between meta.score categories and clinical course status (p-value of chi-square test); (G) a mosaic plot showing the relationship between meta.score categories and clinical event (p-value of chi-square test); (H) a mosaic plot showing the relationship between meta.score categories and CHIC risk stratification (p-value of chi-square test).
Figure 4
Figure 4
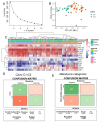
A comparative analysis of meta.score and C1–C2 classifier in the prediction of metastasis using dataset GSE131329. (A) The efficiency yield of cluster numbers during k-means clustering based on the C1–C2 expression signature; (B) principal component analysis with stratification of the C1/C2 group based on the Cairo signature; (C) unsupervised clustering of the C1/C2 signature, with stratification by Cairo prediction, metastasis status, and meta.score (metabolism); (D) a confusion matrix testing the accuracy of the Cairo C1–C2 classifier in predicting metastasis status; and (E) a confusion matrix testing the accuracy of meta.score in predicting metastasis status.
Figure 5
Figure 5
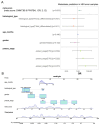
Meta.score as a novel, independent predictor of metastasis in hepatoblastoma tumors. (A) A forest plot of the regression binomial clinical-biological model with metastasis status as the outcome, incorporating distinct parameters: age at diagnosis (age_months), meta.score (combined expression of DNMT3B and PFKFB4), patient gender (with female as the reference category), histological type of tumor (with ‘other’ as the reference category), and PRETEXT stage (with stage 1 (P1) as the reference category, and subsequent stages denoted as P2: stage 2, P3: stage 3, and P4: stage 4). (B) A nomogram of the regression metastasis model, displaying odds ratios (OR).

References

    1. Perilongo G., Shafford E., Plaschkes J., Liver Tumour Study Group of the International Society of Paediatric Oncology SIOPEL Trials Using Preoperative Chemotherapy in Hepatoblastoma. Lancet Oncol. 2000;1:94–100. doi: 10.1016/S1470-2045(00)00018-8. - DOI - PubMed
    1. Sasaki F., Matsunaga T., Iwafuchi M., Hayashi Y., Ohkawa H., Ohira M., Okamatsu T., Sugito T., Tsuchida Y., Toyosaka A., et al. Outcome of Hepatoblastoma Treated with the JPLT-1 (Japanese Study Group for Pediatric Liver Tumor) Protocol-1: A Report from the Japanese Study Group for Pediatric Liver Tumor. J. Pediatr. Surg. 2002;37:851–856. doi: 10.1053/jpsu.2002.32886. - DOI - PubMed
    1. Meyers R.L., Maibach R., Hiyama E., Häberle B., Krailo M., Rangaswami A., Aronson D.C., Malogolowkin M.H., Perilongo G., von Schweinitz D., et al. Risk-Stratified Staging in Paediatric Hepatoblastoma: A Unified Analysis from the Children’s Hepatic Tumors International Collaboration. Lancet Oncol. 2017;18:122–131. doi: 10.1016/S1470-2045(16)30598-8. - DOI - PMC - PubMed
    1. Koh K.N., Park M., Kim B.E., Bae K.W., Kim K.M., Im H.J., Seo J.J. Prognostic Implications of Serum Alpha-Fetoprotein Response during Treatment of Hepatoblastoma. Pediatr. Blood Cancer. 2011;57:554–560. doi: 10.1002/pbc.23069. - DOI - PubMed
    1. Meyers R.L., Rowland J.R., Krailo M., Chen Z., Katzenstein H.M., Malogolowkin M.H. Predictive Power of Pretreatment Prognostic Factors in Children with Hepatoblastoma: A Report from the Children’s Oncology Group. Pediatr. Blood Cancer. 2009;53:1016–1022. doi: 10.1002/pbc.22088. - DOI - PMC - PubMed

MeSH terms

Substances

LinkOut - more resources