. 2024 Nov 17;14(11):1454.
doi: 10.3390/biom14111454.

Chaga Mushroom Triterpenoids Inhibit Dihydrofolate Reductase and Act Synergistically with Conventional Therapies in Breast Cancer

Affiliations

Chaga Mushroom Triterpenoids Inhibit Dihydrofolate Reductase and Act Synergistically with Conventional Therapies in Breast Cancer

Junbiao Wang et al. Biomolecules. .

Abstract

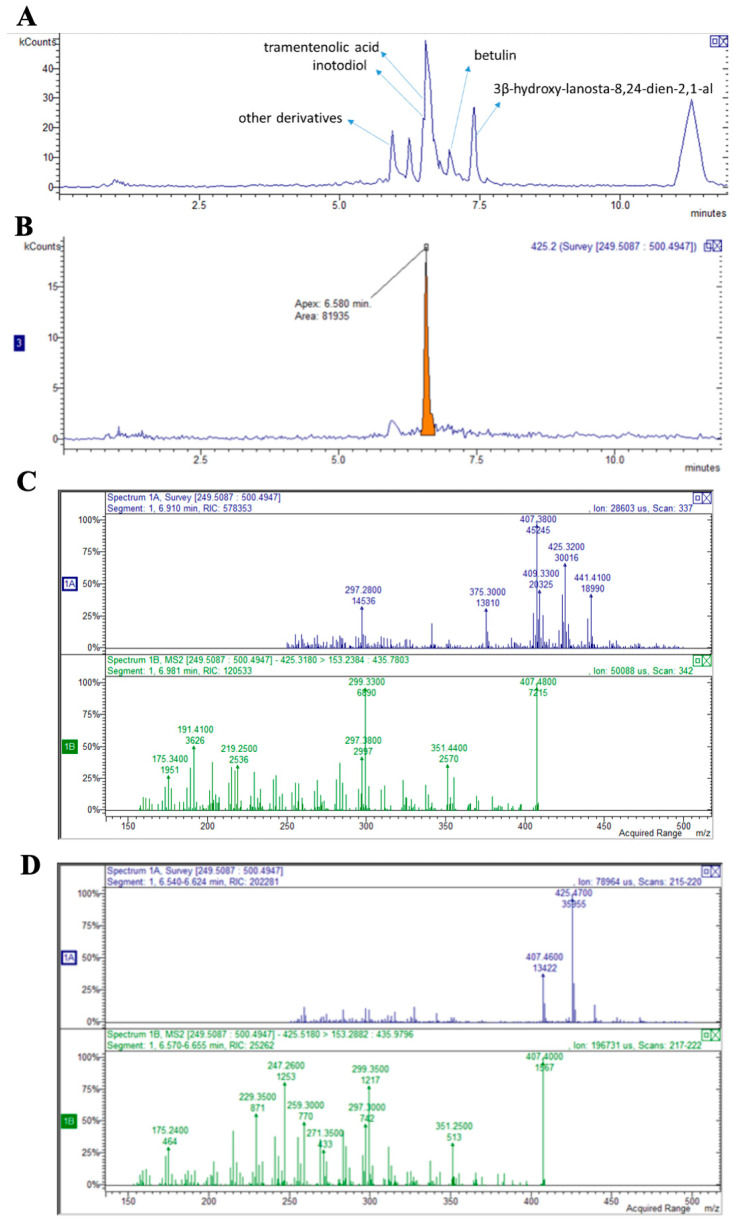
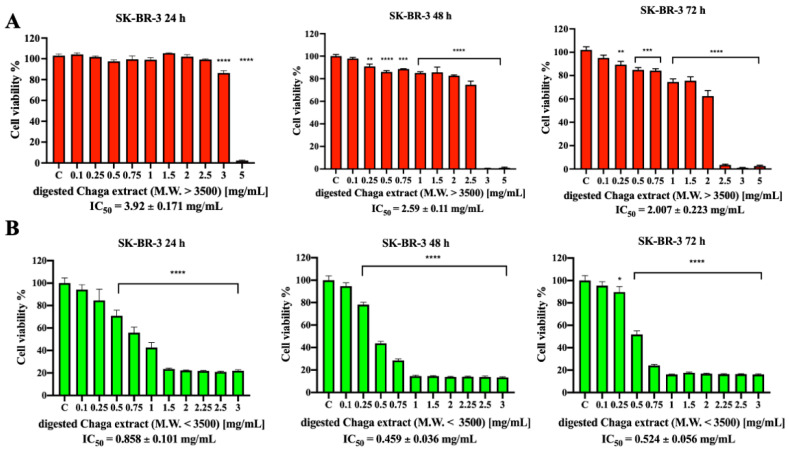
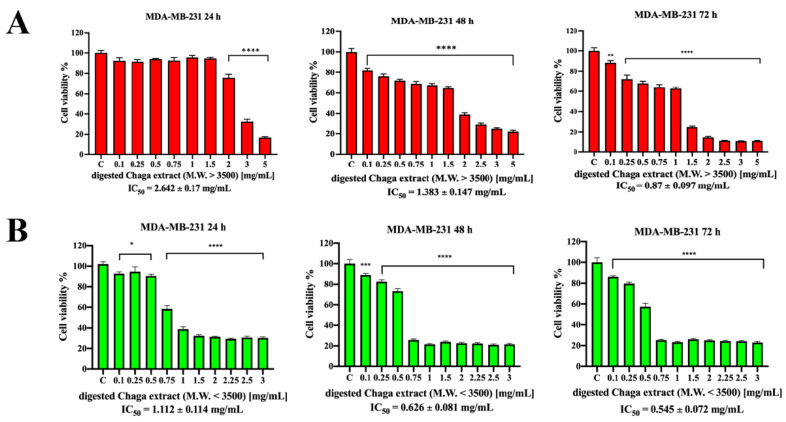
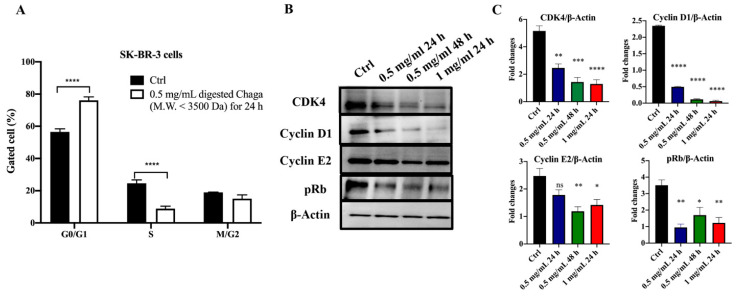
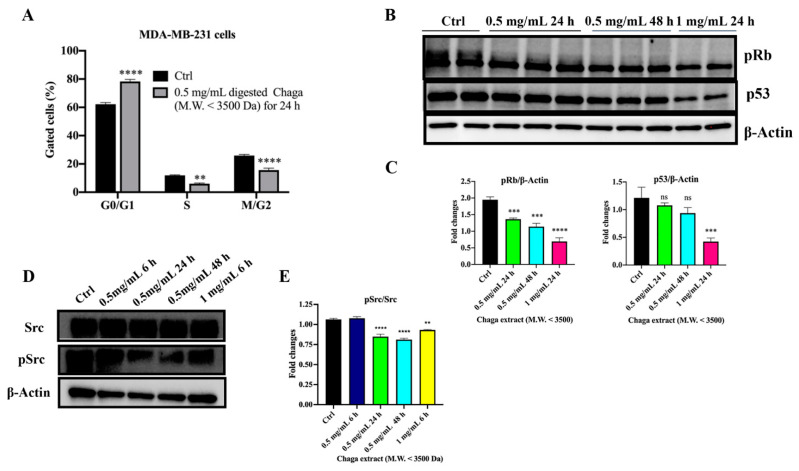
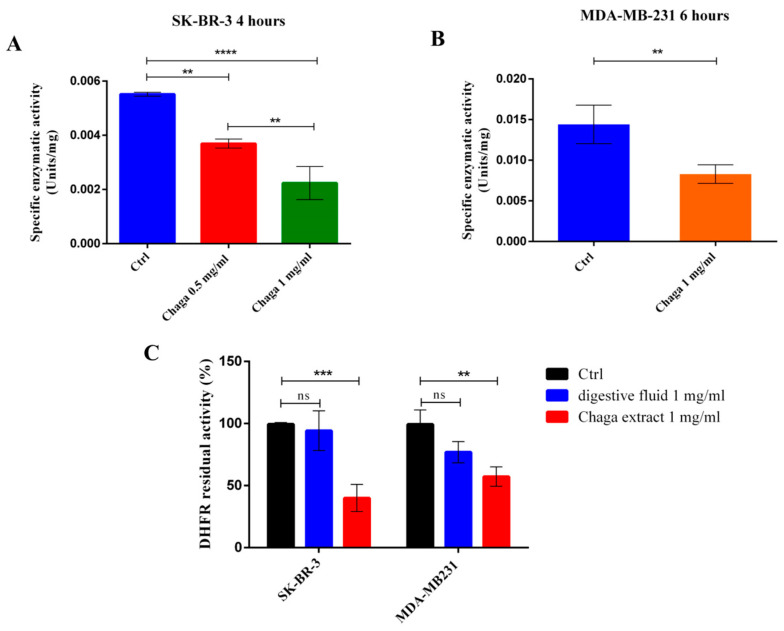
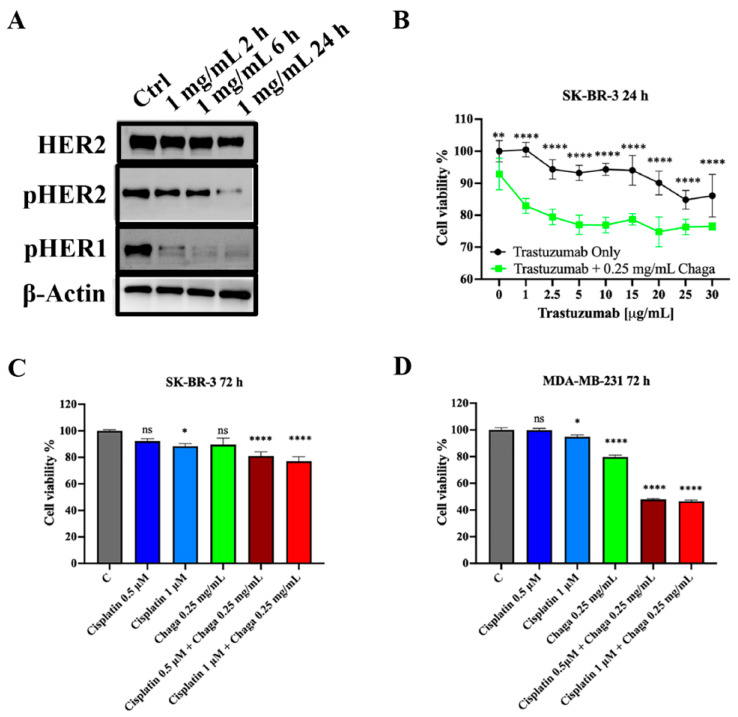
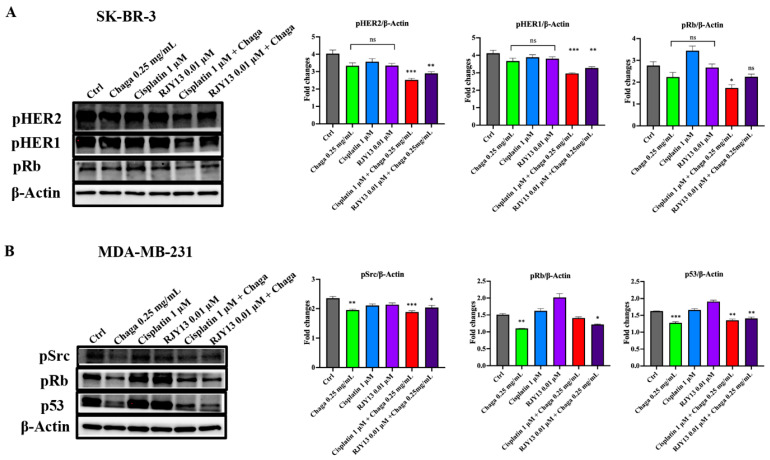
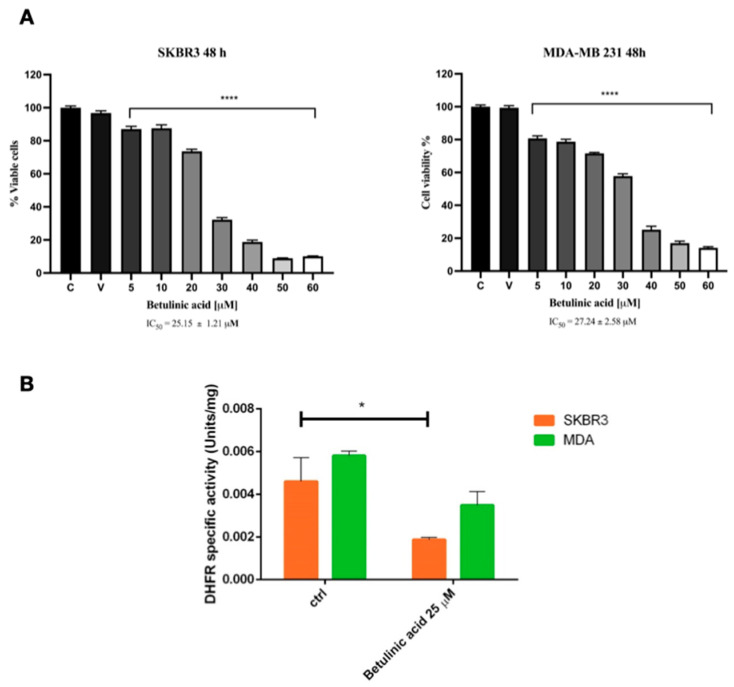
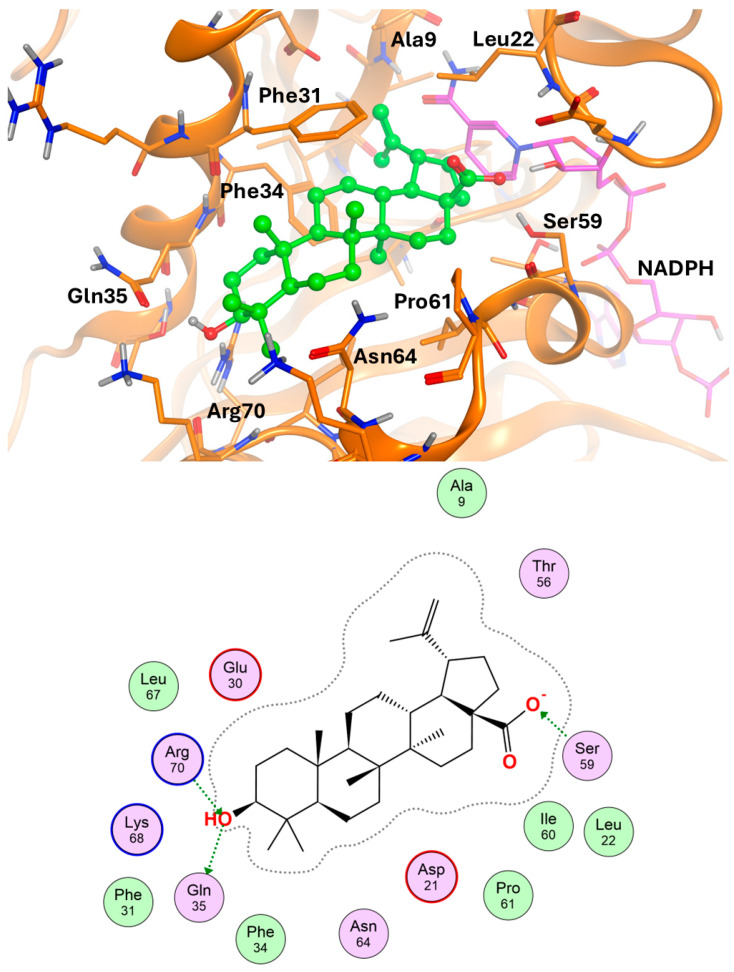
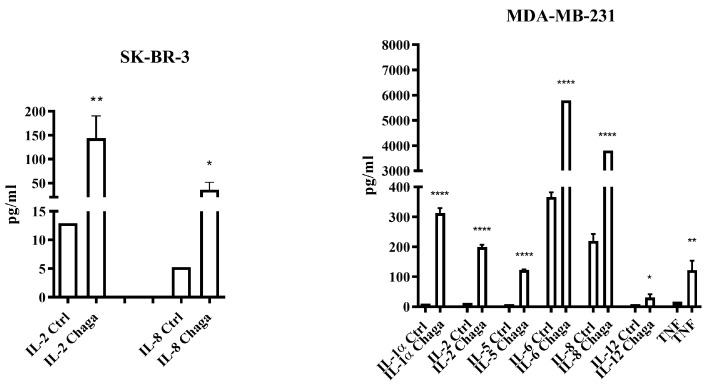
Inonotus obliquus (Chaga) is a medicinal mushroom with several pharmacological properties that is used as a tea in traditional Chinese medicine. In this study, Chaga water extract was digested in vitro to mimic the natural processing and absorption of its biocomponents when it is consumed as functional beverage, and its anticancer activities were evaluated in breast cancer (BC) cell lines, representing HER2-positive and triple-negative subtypes. After chemical characterization by liquid chromatography/mass spectrometry (HR-QTOF) analysis, the effect of Chaga biocomponents on cell viability and cell cycle progression was assessed by MTT assay, FACS analysis, and Western blot. Dihydrofolate reductase (DHFR) activity was measured by an enzymatic assay. Four highly bioactive triterpenoids (inotodiol, trametenolic acid, 3-hydroxy-lanosta-8,24-dien-21-al, and betulin) were identified as the main components, able to decrease BC cell viability and block the cell cycle in G0/G1 by inducing the downregulation of cyclin D1, CDK4, cyclin E, and phosphorylated retinoblastoma protein. DHFR was identified as their crucial target. Moreover, bioactive Chaga components exerted a synergistic action with cisplatin and with trastuzumab in SK-BR-3 cells by inhibiting both HER2 and HER1 activation and displayed an immunomodulatory effect. Thus, Inonotus obliquus represents a source of triterpenoids that are effective against aggressive BC subtypes and display properties of targeted drugs.

Keywords: Chaga mushroom (Inonotus obliquus); DHFR; breast cancer; cell cycle regulation; triterpenoids.


Conflict of interest statement

The authors declare no conflicts of interest.

Figures

Figure 1
Figure 1
HPLC/MS identification of the terpenoid components of Chaga extract: (A) chromatogram with the identified peaks; (B) chromatogram recorded in positive mode in which a peak at 6.5 min, with m/z of 425, can be identified as inotodiol; (C) MS fragmentation pathway of betulin in positive ion mode showing the species at m/z 425 and fragment ions at m/z 407 and 191; (D) MS fragmentation pathway of inotodiol in positive ion mode 425 m/z and fragment ions at m/z 407 and 247.
Figure 2
Figure 2
Effect of digested Chaga extract on SK-BR-3 cell viability. SK-BR-3 cells were left untreated (control) or incubated for 24 h, 48 h, or 72 h in the presence of increasing concentrations of the high-molecular-weight fraction (MW > 3500 Da) (A) or the low-molecular-weight fraction (MW < 3500 Da) (B) of digested Chaga water extract; cell viability was determined by MTT assay. The results are expressed as the percentage of living cells with respect to control. Columns: mean of three separate experiments wherein each treatment was repeated in 6 wells. Bars: SE. * p < 0.05, ** p < 0.01, *** p < 0.001, **** p < 0.0001. One-way ANOVA followed by Dunnett’s multiple comparison test.
Figure 3
Figure 3
Effect of digested Chaga extract on MDA-MB-231 cell viability. MDA-MB-231 cells were left untreated (control) or incubated for 24 h, 48 h, or 72 h in the presence of increasing concentrations of the high-molecular-weight fraction (MW > 3500 Da) (A) or the low-molecular-weight fraction (MW < 3500 Da) (B) of digested Chaga water extract; cell viability was determined by MTT assay. The results are expressed as the percentage of living cells with respect to the control. Columns: mean of three separate experiments wherein each treatment was repeated in 6 wells. Bars: SE. * p < 0.05, *** p < 0.001, **** p < 0.0001. One-way ANOVA followed by Dunnett’s multiple comparison test.
Figure 4
Figure 4
Digested Chaga extract (MW < 3500 Da) induced cell cycle arrest in the G0/G1 phase in SK-BR-3 cells. (A) Histograms showing the percentage of SK-BR-3 cells in the G0/G1, S, and G2/M phases in control condition or following 24 h treatment with 0.5 mg/mL of digested Chaga extract (MW < 3500 Da) as assessed by FACS cell cycle analysis. Data are presented as the mean ± SD of three repeats. **** p < 0.0001 vs. control. ANOVA followed by Sidak’s multiple comparison test. (B) Representative Western blotting showing the expression of CDK4, cyclin D1, cyclin E2, phosphorylated Rb protein (Ser 780), and β-actin (loading control) in SK-BR-3 cells left untreated (Ctrl) or treated with 0.5 mg/mL or 1 mg/mL of digested Chaga extract (MW < 3500 Da) for 24 h or 48 h. Twenty micrograms of proteins/well were loaded. (C) Densitometric analysis of each assessed protein. Data are presented as the mean ± SE of three repeats. * p < 0.05, ** p < 0.01, *** p < 0.001, **** p < 0.0001. ns: not significant. One-way ANOVA followed by Dunnet’s multiple comparison test.
Figure 5
Figure 5
Digested Chaga extract (MW < 3500 Da) induced cell cycle arrest in the G0/G1 phase in MDA-MB-231 cells. (A) Histograms showing the percentage of MDA-MB-231 cells in the G0/G1, S, and G2/M phases, in the control condition or following 24 h treatment with 0.5 mg/mL of digested Chaga extract (MW < 3500 Da) assessed by FACS cell cycle analysis. Data are presented as the mean ± SD of three repeats. ** p < 0.01, **** p < 0.0001 vs. control. ANOVA followed by Sidak’s multiple comparison test. (B) Representative Western blotting showing the expression of phosphorylated Rb protein (Ser 780), p53, and β-actin (loading control) in MDA-MB-231 cells, left untreated (Ctrl) or treated with 0.5 mg/mL or 1 mg/mL of digested Chaga extract (MW < 3500 Da) for 24 h or 48 h. Twenty micrograms of proteins/well were loaded. (C) Densitometric quantifications of pRb and p53 expression, normalized on β-actin, are shown; data are presented as the mean ± SD of three repeats. *** p < 0.001, **** p < 0.0001. ns: not significant. One-way Anova, followed by Dunnet’s multiple comparison test. (D) Representative Western blotting showing the expression of phosphorylated Src protein (pSrc), Src, and β-actin (loading control) in MDA-MB-231 cells left untreated (Ctrl) or treated with digested Chaga extract (MW < 3500 Da) at the indicated time and concentrations. (E) Densitometric quantifications of pSrc/Src from three independent experiments are shown; data are presented as the mean ± SE of three repeats. ** p < 0.01, **** p < 0.0001. One-way ANOVA, followed by Dunnet’s multiple comparison test.
Figure 6
Figure 6
Digested Chaga extract inhibited DHFR enzymatic activity in BC cells. Residual enzymatic activity of DHFR was analyzed in SK-BR-3 (A) and MDA-MB-231 (B) cells after a 4–6 h treatment with 0.5 mg/mL or 1 mg/mL digested Chaga extract (MW < 3500 Da). (C) The residual enzymatic activity of DHFR (as % of the control) is reported in the presence of Chaga extract 1 mg/mL in comparison with the residual activity obtained in the presence of the mixture of digestive fluids used to prepare the Chaga extract at 1 mg/mL. Data are reported as the average of three replicates ± SE, ** p ≤ 0.01; *** p ≤ 0.001; **** p ≤ 0.0001. ns: not significant. One-way ANOVA followed by Tukey’s multiple comparison test.
Figure 7
Figure 7
Digested Chaga extract impaired HER2 activation and acted synergistically with trastuzumab and cisplatin. (A) Representative Western blotting showing the expression of HER2, phospho-HER2, phospho-HER1, and β-actin (loading control) in SK-BR-3 cells, left untreated (Ctrl) or treated with 1 mg/mL of digested Chaga extract (MW < 3500 Da) for 2 h, 6 h, or 24 h. Twenty micrograms of proteins/well were loaded. (B) SK-BR-3 cells were plated onto 96-well plates, treated with increasing concentrations of trastuzumab alone or in combination with a fixed, sub-toxic concentration (0.25 mg/mL) of digested Chaga extract (MW < 3500 Da); cell viability was determined by MTT assay. (C) SK-BR-3 cells and (D) MDA-MB-231 cells were treated with the indicated concentrations of cisplatin alone or in combination with 0.25 mg/mL digested Chaga extract (MW < 3500 Da); cell viability was determined by MTT assay. Drug interaction was evaluated by the Bliss Independence model; the observed effects of the drug combination indicated synergistic interaction (calculations are reported in Table S3). Bars: SE. * p < 0.05, ** p < 0.01, **** p < 0.0001. ns: not significant. One-way ANOVA followed by Dunnett’s multiple comparison test. Data show a representative of three independent experiments.
Figure 8
Figure 8
Oncogenic pathways in SK-BR-3 and MDA-MB-231 cells treated with Chaga extract in combination with platinum-based chemotherapeutics. (A) Left panel: representative Western blotting showing the expression of phosphorylated (p) HER1, pHER2, pRb protein (Ser 780), and β-actin (loading control) in SK-BR-3 cells left untreated (Ctrl) or treated with 0.25 mg/mL of digested Chaga extract (MW < 3500 Da) alone, 1µM cisplatin or its derivative 0.01 µM RJY13 alone, or their combination for 72 h. Twenty micrograms of proteins/well were loaded. Right panel: densitometric quantifications of pHER1, pHER2, and pRb expression, normalized on β-actin, are shown; data are presented as the mean ± SE of three repeats. (B) Left panel: representative Western blotting showing the expression of phosphorylated (p) Src, pRb protein (Ser 780), p53, and β-actin (loading control) in MDA-MB-231 cells left untreated (Ctrl) or treated with 0.25 mg/mL of digested Chaga extract (MW < 3500 Da) alone, 1 µM cisplatin or its derivative 0.01 µM RJY13 alone, or their combination for 72 h. Twenty micrograms of proteins/well were loaded. Right panel: densitometric quantifications of pSrc, pRb, and p53 expression, normalized on β-actin, are shown; data are presented as the mean ± SE of three repeats. * p < 0.05, ** p < 0.01, *** p < 0.001. ns: not significant. One-way ANOVA, followed by Dunnet’s multiple comparison test.
Figure 9
Figure 9
Sensitivity of breast cancer cells SK-BR-3 and MDA-MB-231 to betulinic acid in terms of (A) cell viability and (B) DHFR enzymatic activity. Data are reported as the average of three replicates ± SE, * p < 0.05, **** p < 0.0001. One-way ANOVA followed by Tukey’s multiple comparison test.
Figure 10
Figure 10
(Above): simulated binding mode of the betulinic acid (green) at the binding cavity of the DHFR; the key residues for ligand–target interaction are shown. (Below): schematic plot of ligand–target interaction.
Figure 11
Figure 11
Digested Chaga extract (MW < 3500 Da) induced cytokine release in the culture medium of both SK-BR-3 and MDA-MB-231 cultures but differently according to the cell line. Cytokines were quantified by using a multiplex immunoassay, as described in Materials and Methods section. Data were analyzed by Student’s t-test. * p < 0.05, ** p < 0.01, **** p < 0.0001, with respect to the corresponding Ctrl supernatant cytokine concentration.

References

    1. Perou C.M., Sørlie T., Eisen M.B., van de Rijn M., Jeffrey S.S., Rees C.A., Pollack J.R., Ross D.T., Johnsen H., Akslen L.A., et al. Molecular portraits of human breast tumours. Nature. 2000;406:747–752. doi: 10.1038/35021093. - DOI - PubMed
    1. Sørlie T., Perou C.M., Tibshirani R., Aas T., Geisler S., Johnsen H., Eisen M.B., Hastie T., van de Rijn M., Jeffrey S.S., et al. Gene expression patterns of breast carcinomas distinguish tumor subclasses with clinical implications. Proc. Natl. Acad.Sci. USA. 2001;98:10869–10874. doi: 10.1073/pnas.191367098. - DOI - PMC - PubMed
    1. Millar E.K., Graham P.H., O’Toole S.A., McNeil C.M., Browne L., Morey A.L., Eggleton S., Beretov J., Theocharous C., Capp A., et al. Prediction of local recurrence, distant metastases, and death after breast-conserving therapy in early-stage invasive breast cancer using a five-biomarker panel. J. Clin. Oncol. 2009;27:4701–4708. doi: 10.1200/JCO.2008.21.7075. - DOI - PubMed
    1. Rexer B.N., Arteaga C.L. Intrinsic and acquired resistance to HER2-targeted therapies in HER2 gene-amplified breast cancer: Mechanisms and clinical implications. Crit. Rev. Oncog. 2012;17:1–16. doi: 10.1615/CritRevOncog.v17.i1.20. - DOI - PMC - PubMed
    1. Liu S.H., Chen P.S., Huang C.C., Hung Y.T., Lee M.Y., Lin W.H., Lin Y.C., Lee A.Y. Unlocking the Mystery of the Therapeutic Effects of Chinese Medicine on Cancer. Front. Pharmacol. 2021;11:601785. doi: 10.3389/fphar.2020.601785. - DOI - PMC - PubMed

MeSH terms