Review
. 2024 Oct 30;14(11):1101.
doi: 10.3390/brainsci14111101.

Alzheimer's Disease, Obesity, and Type 2 Diabetes: Focus on Common Neuroglial Dysfunctions (Critical Review and New Data on Human Brain and Models)

Affiliations
Review

Alzheimer's Disease, Obesity, and Type 2 Diabetes: Focus on Common Neuroglial Dysfunctions (Critical Review and New Data on Human Brain and Models)

Adolfo Toledano et al. Brain Sci. .

Abstract

Background/objectives: Obesity, type 2 diabetes (T2D), and Alzheimer's disease (AD) are pathologies that affect millions of people worldwide. They have no effective therapy and are difficult to prevent and control when they develop. It has been known for many years that these diseases have many pathogenic aspects in common. We highlight in this review that neuroglial cells (astroglia, oligodendroglia, and microglia) play a vital role in the origin, clinical-pathological development, and course of brain neurodegeneration. Moreover, we include the new results of a T2D-AD mouse model (APP+PS1 mice on a high-calorie diet) that we are investigating.

Methods: Critical bibliographic revision and biochemical neuropathological study of neuroglia in a T2D-AD model.

Results: T2D and AD are not only "connected" by producing complex pathologies in the same individual (obesity, T2D, and AD), but they also have many common pathogenic mechanisms. These include insulin resistance, hyperinsulinemia, hyperglycemia, oxidative stress, mitochondrial dysfunction, and inflammation (both peripheral and central-or neuroinflammation). Cognitive impairment and AD are the maximum exponents of brain neurodegeneration in these pathological processes. both due to the dysfunctions induced by metabolic changes in peripheral tissues and inadequate neurotoxic responses to changes in the brain. In this review, we first analyze the common pathogenic mechanisms of obesity, T2D, and AD (and/or cerebral vascular dementia) that induce transcendental changes and responses in neuroglia. The relationships between T2D and AD discussed mainly focus on neuroglial responses. Next, we present neuroglial changes within their neuropathological context in diverse scenarios: (a) aging involution and neurodegenerative disorders, (b) human obesity and diabetes and obesity/diabetes models, (c) human AD and in AD models, and (d) human AD-T2D and AD-T2D models. An important part of the data presented comes from our own studies on humans and experimental models over the past few years. In the T2D-AD section, we included the results of a T2D-AD mouse model (APP+PS1 mice on a high-calorie diet) that we investigated, which showed that neuroglial dysfunctions (astrocytosis and microgliosis) manifest before the appearance of amyloid neuropathology, and that the amyloid pathology is greater than that presented by mice fed a normal, non-high-caloric diet A broad review is finally included on pharmacological, cellular, genic, and non-pharmacological (especially diet and lifestyle) neuroglial-related treatments, as well as clinical trials in a comparative way between T2D and AD. These neuroglial treatments need to be included in the multimodal/integral treatments of T2D and AD to achieve greater therapeutic efficacy in many millions of patients.

Conclusions: Neuroglial alterations (especially in astroglia and microglia, cornerstones of neuroinflammation) are markedly defining brain neurodegeneration in T2D and A, although there are some not significant differences between each of the studied pathologies. Neuroglial therapies are a very important and p. promising tool that are being developed to prevent and/or treat brain dysfunction in T2D-AD. The need for further research in two very different directions is evident: (a) characterization of the phenotypic changes of astrocytes and microglial cells in each region of the brain and in each phase of development of each isolated and associated pathology (single-cell studies are mandatory) to better understand the pathologies and define new therapeutic targets; (b) studying new therapeutic avenues to normalize the function of neuroglial cells (preventing neurotoxic responses and/or reversing them) in these pathologies, as well as the phenotypic characteristics in each moment of the course and place of the neurodegenerative process.

Keywords: Alzheimer’s disease (AD); astroglia; microglia; neuroglia; neuroglial dysfunctions; neuroglial therapy; neuroinflammation; neuropathology; obesity; oligodendroglia; pathogenic mechanisms; type 2 diabetes (T2D).


Conflict of interest statement

The authors declare no conflicts of interest.

Figures

Figure 1
Figure 1
Pathways of neurodegeneration in the diabetic brain. Critical links between type 2 diabetes (T2D) and Alzheimer’s disease (AD). The two main neuropathological manifestations in AD are intracellular deposits of hyperphosphorylated tau protein (phospho-tau), which give rise to dysfunctional dystrophic neurites and neurons bearing neurofibrillary tangles, and extracellular deposits of beta-amyloid protein. Both pathologic alterations are facilitated by insulin resistance, the major cause of T2D. Insulin resistance, through the activation of Akt and GSK3-beta, increases the phosphorylation of the tau protein. Moreover, through increased insulinemia, the clearance of the beta-amyloid protein decreases by deactivating the insulin-degrading enzyme (IDE). On the other hand, hyperglycemia induced by T2D leads to an overproduction of beta-amyloid protein (Abeta) that is deposited, to a substantial extent, as plaques and/or diffuse amyloid. Chronic hyperglycemia generates advanced glycation end products (AGEs) and oxidative stress that induces neuronal degeneration and neuronal dysfunctions/neuroinflammation (that also cause higher neurodegeneration). Related peripheral inflammation induced by T2D, through cytokines, free radicals, and AGEs, increases neuroinflammation, key pathogenic mechanism for AD neurodegeneration. Phospho-tau and beta-amyloid also activate these neurodegenerative processes in a vicious cycle. T2D induces AD, and AD induces T2D and related peripheral inflammation (based on [32,48]).
Figure 2
Figure 2
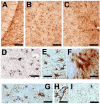
Reactive astrocytes. (AC) Reactive astrocytes induced in hippocampus. (A,B) Reactive astrocytes induced by pilocarpine injection in rats. All astrocytes react simultaneously, maintaining their location and morphology ((A): dentate gyrus (DG); (B): DG hilus)). (C) Reactive astrocytes with different intensities and dislocation after injection of pro-inflammatory lipopolysaccharide (LPS). (AC); GFAP immunostaining without contrast). (D) Reactive astrocytes in Brodman area 46 from an AD Braak V case. Reactive astrocytes with their complex network of fine processes (intensification of the GFAP-immunoreaction with Ni). (E) Reactive astrocytes in Brodman area 46, layer III, from an AD Braak V case (GFAP-immunoreaction, hematoxylin contrast). (F) Cluster of GFAP hyperreactive astrocytes (normal and hypertrophic sizes, including “velate” type) in the intersection of the granule cell layer and the white matter of the cerebellum of an AD case (GFAP immunostaining and hematoxylin contrast). (G) Reactive astocytes associated with a blood vessel (left) and a neuron bearing a prominent tangle. (H) Hypertrophic perivascular astroglial endings surrounding a blood vessel. (G,H), GFAP immunostaining with contrast of hematoxylin). (I) Brodmann area 46, brain of a 96-year-old man with no signs of cognitive decline. Astrocyte displays unusually long processes running through all layers of the cortex. Some astrocytes of this last type have also been observed in the cerebellar cortex. BAR (microns): (A,D,F,G) = 50; (E) = 40; (H) = 20; (I) = 75.
Figure 3
Figure 3
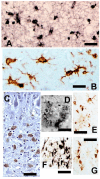
Microglial reactive cells. Microglial reactive cells of different morphological types (rounded with few processes, elongated or fusiform with long/medium processes, each of them more or less branched). (A) Different morphological subtypes with different processes of distinct size forming a complex plexus in the neuropil of an area of the Brodman 46 region from an AD Braak V brain. Staining with LN3 intensified with Ni. (B) Neuropil of hypercaloric treated AD mice, frontoparietal cortex. Hypertrophic branched elements. Iba-1 immunostaining without contrast. (C) Hippocampal polymorphic sub-CA3 layer in a case of Braak IV human AD showing highly hypertrophic phagocytic round microglial cells. Iba-1 immunostaining with hematoxylin contrast AD case, Hippocampus CA 3 region. (D) Amyloid plaque invaded peripherally by microglial cells (Bielchowsky silver-impregnation technique); Brodman area 46 from an AD Braak V case. (E) Atrophic microglial cells related to a plaque without reactive microglial cells The same case of D. (F) Large amyloid plaque invaded by microglial cells in a case of diabetogenic treated APP-PS1 AD model. Iba-1 immunostaining with hematoxylin contrast and Ni reinforcement. (G) Microglial cells forming a crown not closely related to an amyloid plaque in the same case. BAR (microns): (AC) = 50; (D,F) = 65; (E,G) = 60.
Figure 4
Figure 4
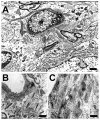
Electron microscopy images of reactive astrocytes. Granular layer of the cerebellum of 36-month-old rat. (A) Astrocyte showing numerous thick fascicles of gliofibrils and pleomorphic dense bodies, highly altered mitochondria of quite different sizes (hypertrophied and/or very long, or very small); dense bodies; concentric lamellae; and encapsulated small, round, pyknotic masses or degenerated axonal elements. (B) Hypertrophic perivascular astroglial endings surrounding a vessel with an abundance of inter-astroglia junctions. The blood vessel shows thickening of the endothelium and the basement membrane. This can negatively affect the BBB. (B,C) Different layers of hypertrophic perivascular astroglial endings surrounding blood vessels. Section of the glial processes normal to the gliofibril bundles. BAR (microns): (A) = 1.7; (B) = 3; (C) = 1.6.
Figure 5
Figure 5
Electron microscopy images of reactive microglial cells. Cerebellum of 36-month-old rat. (A) Molecular layer. Microglial cell fully loaded with phagocytosed dense bodies. (B) Granule cell layer. Two reactive microglial cells in close contact. (C,D) Microglial reactive cells presenting a long hypertrophic process running through the neuropil and showing some phagosomes. (EH) Microglial reactive cells associated with blood vessels with phagocytic characteristics. The vessels are dilated, and their walls (endothelium, basement membrane, and astroglial envelope) may be thickened. In some cases, microglial processes appear “empty” of subcellular debris (H) These apparently empty formations can reach large sizes. Several authors point out that some of them may also belong to astrocytic cells and degenerate in the empty perivascular spaces observed at the optical microscopy level, especially in degenerative diseases (T2D and AD). BAR (microns): (A,B,E,G) = 10; (C,D,F) = 20; (H) = 3.
Figure 6
Figure 6
Electron microscopy images of hypertrophic astrocyte and microglial cell extensions in the neuropil of the cerebral cortex in senility. A 30-month-old rat. The astrocyte extensions (red in the left image) that surround the neuronal somas, dendrites, and axons are thicker and show constant variations in diameter. The microglial extensions (black in the left image) are more difficult to observe; but varicosities as is presented in the bottom, are observed in some cases. Microglial bodies with lysosomes, vesicles, and residual bodies, such as those observed in Figure 5, predominate. In (A), the extensions of the hypertrophic astrocytes are marked in red and the microglial cells in black as a signaling guide for the structures that can be observed in (B) BAR: 10 microns.
Figure 7
Figure 7
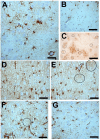
Astroglia in Alzheimer’s disease. Cerebral cortex, layer III, Brodmann area 46. (A) AD case (12 years since diagnosis) (Braak V) with subareas with high (upper area) and low (lower area) presence of reactive astrocytes. In this last subarea, the hyperreactivity of the astrocytic feet surrounding a vessel is striking. (B) Another area of the same case indicates truly low number of astrocytes. (C) Very advanced case (16 years) with little reactive astrocytes, forming clusters located randomly and without any relation to the large presence of amyloid plaques (circles) assessed in parallel sections with amyloid antibodies. (DG) AD Braak IV case (11 years) with different degrees of astrogliosis and amyloid pathology: (D) area without amyloid pathology; (E) area with amyloid pathology unrelated to astrocytes; (F) area with less astrogliosis, mainly confined to forming a crown surrounding a large amyloid plaque and blood vessels; (G) area without amyloid pathology and little astrogliosis. GFAP immunostaining and hematoxylin contrast (except (C)). BAR (microns): (A,B,DG) = 50; (C) = 150.
Figure 8
Figure 8
Microglial cells in Alzheimer’s disease. Cerebral cortex, layers II-IV, Brodmann area 46. (A) AD case (12 years since diagnosis) (Braak V). (A) Microgliosis in a wide area without amyloid plaques. (B) Microgliosis in an area with amyloid plaques; many plaques are infiltrated by microglia, and many cells are more intensely inmmunostained. (B) Different subtypes of microglial cells are highly intermeshed and located at random. (C,D) Highly hypertrophic/hyperreactive cells of different morphologies in two different areas of microglial density. Iba-1 inmunostainning. BAR (microns): (A,B) = 200; (C,D) = 20.
Figure 9
Figure 9
Neuroglial reactivity in the hippocampus and cerebellum. (A) Hippocampal CA3 region in a case of Braak IV human AD. Amyloid plaques of very different types are not accompanied by neuroglial cells; neuroglial nuclei are not evident (Bielchowsky’s silver-impregnation technique). (B) Hippocampal polymorphic sub-CA3 region of another case of Braak V. A large, very dense collection of small reactive astrocytes is observed. There are no amyloid plaques, and very few neuronal profiles are seen. (C) Cerebellum of a Braak V case of human AD. Hypertrophic hyperreactive astrocytes (including Bergman fibers) in the three layers cerebellum and in the white matter. There is no amyloid neuropathology. In the Purkinje layer, nuclei of immunonegative GFAP astrocytic cells are seen (astrocyte hyperplasia). BAR (microns): (A) = 200; (B) = 75; (C) = 50.
Figure 10
Figure 10
Amyloid plaques in type 2 diabetes. Cerebral cortex of a T2D case (12 years of disease course and 3 years of cognitive impairment). Amyloid plaques (stained with amyloid antibody 6E10) are seen, but no infarcts are evident. Blood vessels appear dilated or surrounded by empty spaces. BAR: 80 microns.
Figure 11
Figure 11
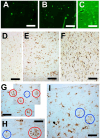
Effect of long-term hypercaloric diet on brain neuro-gliopathology in an experimental Alzheimer’s model (APP-PS1, double-transgenic mice). (A,B) Amyloid plaques and smaller granular deposits at 6 months of age in layers IV-V of the frontoparietal cortex (A) normal diet; (B) hypercaloric diet). (C) Slight accumulation on blood vessel walls (congophilia) in an animal on hypercaloric diet. (AC) thioflavin-S staining). Non-transgenic 6-month-old control mice do not show any amyloid deposits. (DF) Microglial reaction defined by Iba-1 immunostaining. Semi-panoramic view of the microglial reaction at 6 months of age in the sensory frontoparietal cortex in a control case (D), in an APP-PS1 mouse on a normal diet (E), and in another transgenic mouse receiving a hypercaloric diet (F) Increase in microglial cells and greater expression/accumulation of Iba-1 in (E) and, especially, in (F) There is an increase in both rounded microglial forms, without extensions, and in forms with abundant and long extensions. (GI) In the case of receiving normal food, microglial hyperplasia is greater within or around the amyloid plaques (red circles, (E,G,H)), but in animals receiving a high-calorie diet, microglial hyperplasia is greater in the area of the neuropil free of amyloid deposits. Most plaques are not invaded/surrounded by microglial cells (I) (blue circles). In these diabetogenic-induced animals, microgliosis is mainly observed as persistent accumulation of cellular forms with large extensions (I) BAR (microns): (A,B) = 500; (CF) = 100; (G,I) = 50; (H) = 25.
Figure 12
Figure 12
Effect of long-term hypercaloric diet on neuroinflammatory markers in long-term hypercaloric diet/experimental Alzheimer’s model (APP-PS1). Graph showing the percentage increases in neu-roinflammation markers (astrocyte density = Astroc; microglial cell density = Micro; IL-1beta con-centration in cerebral cortex tissue = IL-1beta) in transgenic mice fed a normal (N; blue bars formula image) or hypercaloric (H; blue–white bars formula image) diet versus the mean values given by wild type (non-transgenic) controls. Cholesterol concentrations in the liver (mg/g liver tissue) (Chol liver) are also shown to show damage to peripheral tissues (increasing “metabolic disease” in peripheral organs), which may secondarily increase neuroinflammation. In the groups treated with a hyper-caloric diet, there are statistically significant differences versus the normal control (asterisk) and statistically significant differences versus genetically modified mice fed a normal diet (black square).
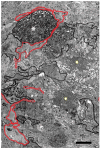
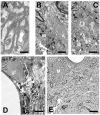
Figure 13
Figure 13
Electron microscopic image of plaques in long-term hypercaloric diet/experimental Alzheimer’s model (APP-PS1). Two closely related amyloid plaques (turquoise stars) are shown with an electron-dense stellate center with radial extensions of similar appearance and surrounded by small areas of lesser or no electron density. Peripherally, neuronal structures (dendrites, axons, neuronal bodies, and axodendritic complexes with numerous synapses) can be seen with many signs of atrophy and dystrophy, with a large accumulation of autophagosomes and remains of subcellular organoid involution. The image highlights an enormous, myelinated axon (white star) completely filled with subcellular debris. Well-recognizable astrocytic processes have been indicated in red, as well as microglial processes in black (especially from phagocytic microglial elements). There is also free cellular debris in the neuropil. BAR: 70 microns.
Figure 14
Figure 14
Electron microscopic images of neuroglial processes in long-term hypercaloric diet/experimental Alzheimer’s model (APP-PS1). (A) Thin sheets of amyloid fibrillar material, similar to the observed extensions of the core of amyloid plaques, are intermingled in the neuropil of areas peripheral to the amyloid plaques. (B) Thick sheets of amyloid fibrillar material, similar to the observed extensions of the core of amyloid plaques, are associated with hypertrophic extensions of microglial cells in the neuropil of areas further away from the amyloid plaques. (C) A structure similar to that presented in B but which also includes axo-dendritic formations of normal appearance. (D) Hypertrophic but highly degenerative astrocyte with hypertrophic condensations of highly condensed gliofibrils (gf) and abundant lysosomes and residual bodies of distinct types surrounding a dilated blood vessel that presents a thinned endothelium and with signs of cellular involution next to the thinned basement membrane in an area with low density of amyloid plaques. (E) Neuropil of an area with low density of amyloid plaques, where a highly dilated blood vessel but of normal structure is observed. Phagocytic microglial cells (M) and hypertrophic astrocytes with abundant gliofibrils (A) or varicose processes are observed in the surrounding neuropil. A = astrocyte; M = microglial cell. BAR (microns): (A) = 1; (BD) = 6; (E) = 20.
Figure 15
Figure 15
Diagram showing the relationship between T2D and AD. T2D and AD have close pathogenic connections. There are genes involved in the development of each of these pathologies and others common to both. External risk and epigenetic factors are similar in both cases, and aging is an inducer of both pathologies. T2D develops mainly in peripheral tissues when metabolic changes occur (left side, in blue). Obesity and/or the various forms of metabolic syndrome condition a state of chronic peripheral inflammation that, through cytokines, AGEs, and ROS, induce the first dysfunctional changes in the neuroglial cells of the brain that initiate neuroinflammation. In any case, the main pathogenic mechanism of peripheral dysmetabolism is the development of insulin resistance that leads to T2D with all the components indicated in the diagram. AD (right side, in red) develops mainly after a process of neuroglial dysfunction that induces neuronal dysfunction, with the appearance of beta-amyloid and phospho-tau protein deposits. In AD, the same components that are indicated in T2D appear in the brain, in addition to specific synaptic and neurotransmitter alterations. Insulin resistance and the development of T2D induce significant AD-inducing changes in the brain, especially neuroglial dysfunction, with the subsequent neuroinflammatory process that is key to neurodegeneration, as well as neuronal involution and promotion of the formation of beta-amyloid and phospho-tau. The possibility that AD may develop as a type of cerebral diabetes (T3D) induced by insulin resistance developed specifically in the brain is also considered (see text).

References

    1. GBD 2019 Dementia Forecasting Collaborators Estimation of the global prevalence of dementia in 2019 and forecasted prevalence in 2050: An analysis for the Global Burden of Disease Study 2019. Lancet Public Health. 2022;7:e105–e125. doi: 10.1016/S2468-2667(21)00249-8. - DOI - PMC - PubMed
    1. American Psychiatric Association . Diagnostic and Statistical Manual of Mental Disorders. 5th ed. American Psychiatric Association; Arlington, VA, USA: 2013. TR.
    1. McKhann G.M., Knopman D.S., Chertkow H. The diagnosis of dementia due to Alzheimer’s disease: Recommendations from the National Institute on Aging-Alzheimer’s Association workgroups on diagnostic guidelines for Alzheimer’s disease. Alzheimers Dement. 2011;7:263–269. doi: 10.1016/j.jalz.2011.03.005. - DOI - PMC - PubMed
    1. Deardorff W.J., Grossberg G.T. Behavioral and psychological symptoms in Alzheimer’s dementia and vascular dementia. Handb. Clin. Neurol. 2019;165:5–32. doi: 10.1016/B978-0-444-64012-3.00002-2. - DOI - PubMed
    1. Jalbert J.J., Daiello L.A., Lapane K.L. Dementia of the Alzheimer type. Epidemiol. Rev. 2008;30:15–34. doi: 10.1093/epirev/mxn008. - DOI - PubMed

LinkOut - more resources