. 2024 Nov 5;25(22):11869.
doi: 10.3390/ijms252211869.

In Vitro Gene Therapy Using Human iPS-Derived Mesoangioblast-Like Cells (HIDEMs) Combined with Microdystrophin (μDys) Expression as the New Strategy for Duchenne Muscular Dystrophy (DMD) Experimental Treatment

Affiliations

In Vitro Gene Therapy Using Human iPS-Derived Mesoangioblast-Like Cells (HIDEMs) Combined with Microdystrophin (μDys) Expression as the New Strategy for Duchenne Muscular Dystrophy (DMD) Experimental Treatment

Marta Budzińska et al. Int J Mol Sci. .

Abstract

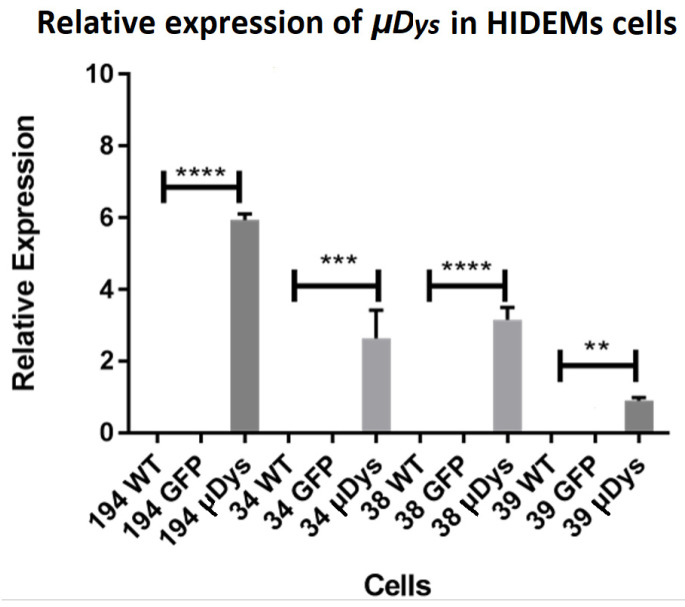
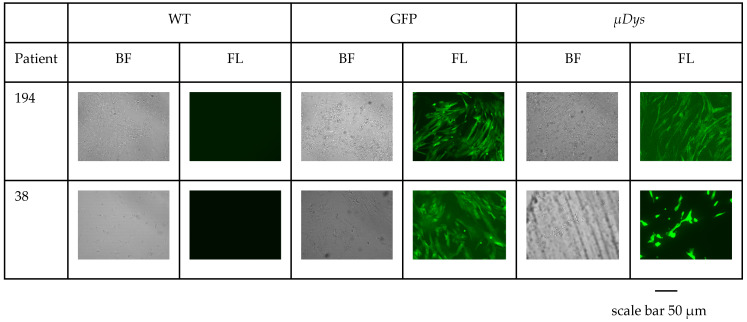
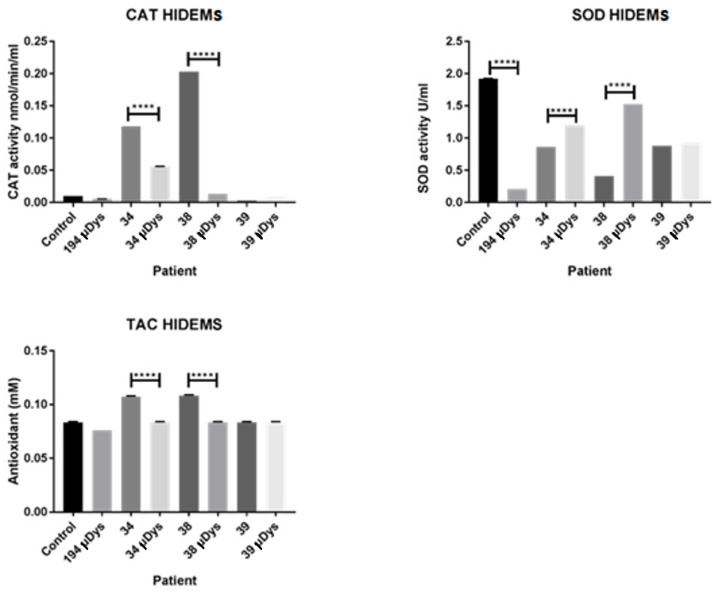
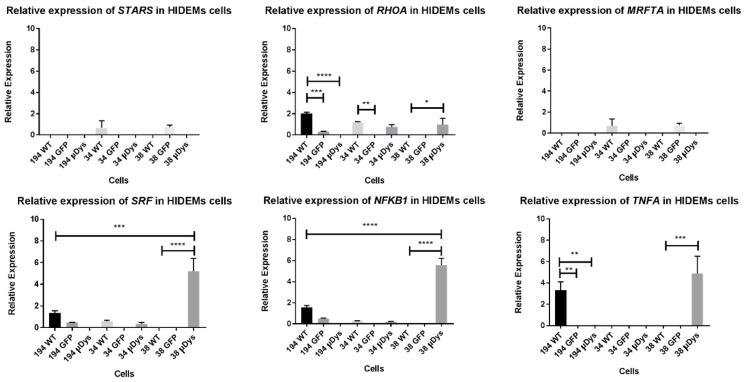
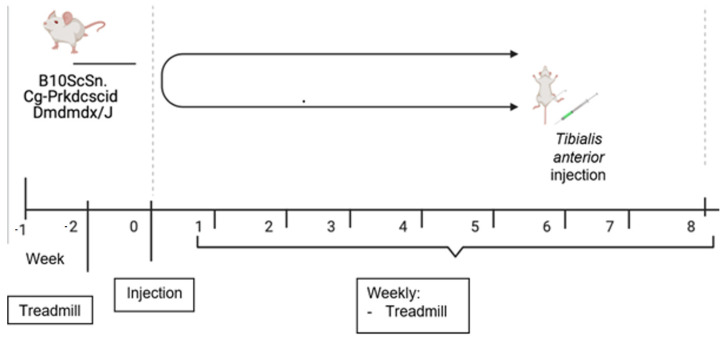
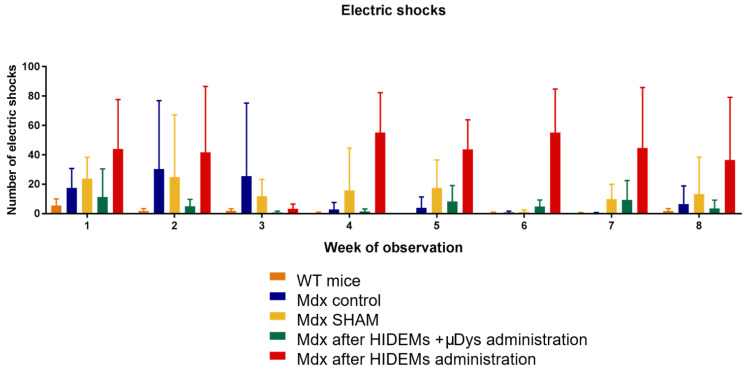
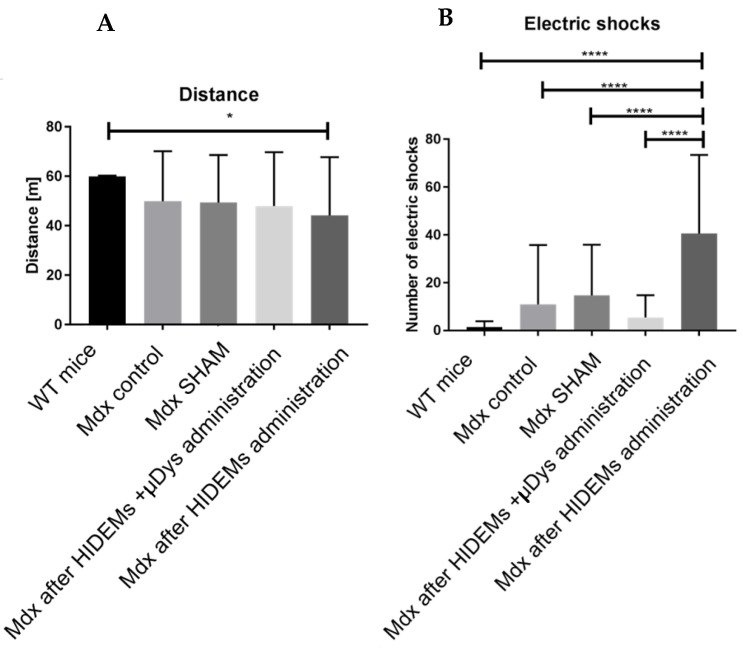
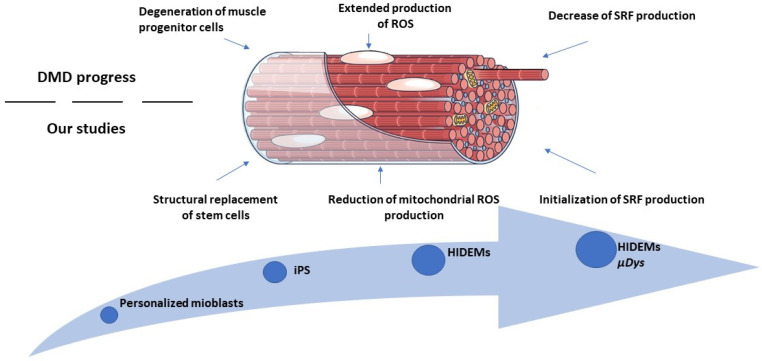
Duchenne Muscular Dystrophy (DMD) is a genetic disorder characterized by disruptions in the dystrophin gene. This study aims to investigate potential a therapeutic approach using genetically modified human iPS-derived mesoangioblast-like cells (HIDEMs) in mdx mouse model. This study utilizes patient-specific myoblasts reprogrammed to human induced pluripotent stem cells (iPSCs) and then differentiated into HIDEMs. Lentiviral vectors carrying microdystrophin sequences have been employed to deliver the genetic construct to express a shortened, functional dystrophin protein in HIDEMs. The study indicated significant changes within redox potential between healthy and pathological HIDEM cells derived from DMD patients studied by catalase and superoxide dismutase activities. Microdystrophin expressing HIDEMs also improved expression of genes involved in STARS (striated muscle activator of Rho signaling) pathway albeit in selective DMD patients (with mild phenotype). Although in vivo observations did not bring progress in the mobility of mdx mice with HIDEMs, microdystrophin interventions this may argue against "treadmill test" as suitable for assessment of mdx mice recovery. Low-level signaling of the Rho pathway and inflammation-related factors in DMD myogenic cells can also contribute to the lack of success in a functional study. Overall, this research contributes to the understanding of DMD pathogenesis and provides insights into potential novel therapeutic strategy, highlighting the importance of personalized gene therapy.

Keywords: Duchenne Muscular Dystrophy; gene therapy; mdx mice; microdystrophin; muscular dystrophy.


Conflict of interest statement

The authors declare no conflicts of interest.

Figures

Figure 1
Figure 1
The expression level of pluripotency marker genes (C-MYC, NANOG, OCT4, SOX2) in control and DMD patients’ iPS cells. Reference genes: ACT, TBP, GAPDH. Statistical significance has been shown by p < 0.05 (*), p < 0.01 (**), p < 0.001 (***). Results were performed using the one-way ANOVA test.
Figure 2
Figure 2
The immunofluorescent staining of OCT4, SOX2, SSEA, NANOG pluripotency markers in control and DMD patients iPS cells. Cells were investigated at the 10th in vitro cell culture passage. Identical patients’ samples were investigated for (A): OCT4, (B): SOX2, (C): CD 73 and CD 31, (D): CD 13 biomarkers. The images were obtained using Leica DMi 8 microscope (Leica Microsystems, Wetzlar, Germany), with 40× zoom.
Figure 2
Figure 2
The immunofluorescent staining of OCT4, SOX2, SSEA, NANOG pluripotency markers in control and DMD patients iPS cells. Cells were investigated at the 10th in vitro cell culture passage. Identical patients’ samples were investigated for (A): OCT4, (B): SOX2, (C): CD 73 and CD 31, (D): CD 13 biomarkers. The images were obtained using Leica DMi 8 microscope (Leica Microsystems, Wetzlar, Germany), with 40× zoom.
Figure 3
Figure 3
The differences in morphology between iPS and HIDEM cells. iPS cells were observed at the 10th in vitro cell culture passage (6 well Tissue Culture Well, Falcon), and HIDEMs at the 2nd in vitro passage (75 cm2 Cell Culture Flask, Falcon). Images were captured using JuLI FL analyzer (NanoEntek, Seul, Republic of Korea) in 4× zoom.
Figure 4
Figure 4
The expression level of mesenchymal marker genes: ANPEP (CD 13), CD 44 (CD 44), ITGA2 (CD 49b), MCAM (CD 146), NT5E (CD 73) and PTPRC (CD 45) genes in control and DMD patients’ derived HIDEMs. Reference genes: ACT, HPRT, GAPDH. Statistical significance has been shown: p < 0.05 (*), p < 0.01 (**), p < 0.001 (***). Results were assessed using the one-way ANOVA test.
Figure 5
Figure 5
The immunofluorescent staining of mesenchymal cell markers (CD 44, CD 45, CD 146, CD 45, CD 73, CD 31, CD 13, and CD 105) in control and DMD patient’s derived HIDEMs. Cells were investigated at the 3rd in vitro cell culture passage. Identical patients’ samples were investigated for (A): CD 44 and CD 105, (B): CD 146 and CD45, (C): CD 73 and CD 31, (D): CD 13 markers. The images were obtained using Leica DMi 8 microscope (Leica Microsystems, Wetzlar, Germany), with 40× zoom.
Figure 5
Figure 5
The immunofluorescent staining of mesenchymal cell markers (CD 44, CD 45, CD 146, CD 45, CD 73, CD 31, CD 13, and CD 105) in control and DMD patient’s derived HIDEMs. Cells were investigated at the 3rd in vitro cell culture passage. Identical patients’ samples were investigated for (A): CD 44 and CD 105, (B): CD 146 and CD45, (C): CD 73 and CD 31, (D): CD 13 markers. The images were obtained using Leica DMi 8 microscope (Leica Microsystems, Wetzlar, Germany), with 40× zoom.
Figure 6
Figure 6
The flow cytometry staining for mesenchymal markers in control and HIDEMs cell populations.
Figure 6
Figure 6
The flow cytometry staining for mesenchymal markers in control and HIDEMs cell populations.
Figure 7
Figure 7
Lentiviral l vector expressing the microdystrophin (μDys) sequence.
Figure 8
Figure 8
The expression level of mRNA transcripts of μDys before and after genetic modification of HIDEM cells. All transduced cells showed a significant relative expression of μDys with respect to non-transduced cells. Statistical significance has been shown: p < 0.01 (**), p < 0.001 (***), p < 0.0001 (****). Results were performed using the one-way ANOVA test.
Figure 9
Figure 9
The overview of transduced HIDEM cells. HIDEM cells were observed on the 7th day of in vitro culture after transduction (100 × 20 mm Tissue Culture Dish, Falcon). Images were captured using JuLI FL analyzer (NanoEntek, Seul, Republic of Korea) in 40× zoom. Visible fluorescence of cells confirms the efficient transduction process. Abbreviations: WT—wild type, GFP—Green fluorescent protein transduction, μDys—microdystrophin transduction, BF—bright field canal, FL—fluorescence canal.
Figure 10
Figure 10
The level of CAT SOD and TAC activities before and 2 weeks after genetic modification of HIDEM cells, p < 0.0001 (****).
Figure 11
Figure 11
The comparison of the expression level of STARS pathway members in HIDEMs cells before and after lentiviral transduction. Statistical significance has been shown: p < 0.05 (*), p < 0.01 (**), p < 0.001 (***), p < 0.0001 (****). Results were assessed using the one-way ANOVA test.
Figure 12
Figure 12
Animal experimental scheme.
Figure 13
Figure 13
Average number of electric shocks exerted to mdx mouse groups under study.
Figure 14
Figure 14
Diagrammatic representation of the entire 8-weeks observation of the treadmill exercise in mdx mouse groups (A): The sum of traveled distance in mouse groups. (B): Average number of electrocutions (electric shocks) inflicted to test mouse groups; p levels were as follows: * p < 0.05, **** p < 0.0001.
Figure 15
Figure 15
Elements of HIDEMs therapeutic interactions with mechanisms affecting skeletal muscle dysfunction in course of DMD.

Similar articles

References

    1. Mendell J.R., Shilling C., Leslie N.D., Flanigan K.M., Al-Dahhak R., Gastier-Foster J., Kneile K., Dunn D.M., Duval B., Aoyagi A., et al. Evidence-Based Path to Newborn Screening for Duchenne Muscular Dystrophy. Ann. Neurol. 2012;71:304–313. doi: 10.1002/ana.23528. - DOI - PubMed
    1. Bushby K.M.D., Gardner-Medwin D., Nicholson L.V.B., Johnson M.A., Haggerty I.D., Cleghorn N.J., Harris J.B., Bhattacharyal S.S. The Clinical, Genetic and Dystrophin Characteristics of Becker Muscular Dystrophy—II. Correlation of Phenotype with Genetic and Protein Abnormalities. J. Neurol. 1993;240:105–112. doi: 10.1007/BF00858726. - DOI - PubMed
    1. Van Putten M., Hulsker M., Young C., Nadarajah V.D., Heemskerk H., Van Der Weerd L., ’T Hoen P.A.C., Van Ommen G.J.B., Aartsma-Rus A.M. Low Dystrophin Levels Increase Survival and Improve Muscle Pathology and Function in Dystrophin/Utrophin Double-Knockout Mice. FASEB J. 2013;27:2484–2495. doi: 10.1096/fj.12-224170. - DOI - PMC - PubMed
    1. McDonald C.M., Marbán E., Hendrix S., Hogan N., Ruckdeschel Smith R., Eagle M., Finkel R.S., Tian C., Janas J., Harmelink M.M., et al. Repeated Intravenous Cardiosphere-Derived Cell Therapy in Late-Stage Duchenne Muscular Dystrophy (HOPE-2): A Multicentre, Randomised, Double-Blind, Placebo-Controlled, Phase 2 Trial. Lancet. 2022;399:1049–1058. doi: 10.1016/S0140-6736(22)00012-5. - DOI - PubMed
    1. Komaki H., Nagata T., Saito T., Masuda S., Takeshita E., Sasaki M., Tachimori H., Nakamura H., Aoki Y., Takeda S. Systemic Administration of the Antisense Oligonucleotide NS-065/NCNP-01 for Skipping of Exon 53 in Patients with Duchenne Muscular Dystrophy. Sci. Transl. Med. 2018;10:eaan0713. doi: 10.1126/scitranslmed.aan0713. - DOI - PubMed

LinkOut - more resources