

Dynamic Changes in Lymphocyte Populations and Their Relationship with Disease Severity and Outcome in COVID-19
- PMID: 39595989
- PMCID: PMC11593669
- DOI: 10.3390/ijms252211921
Dynamic Changes in Lymphocyte Populations and Their Relationship with Disease Severity and Outcome in COVID-19
Abstract
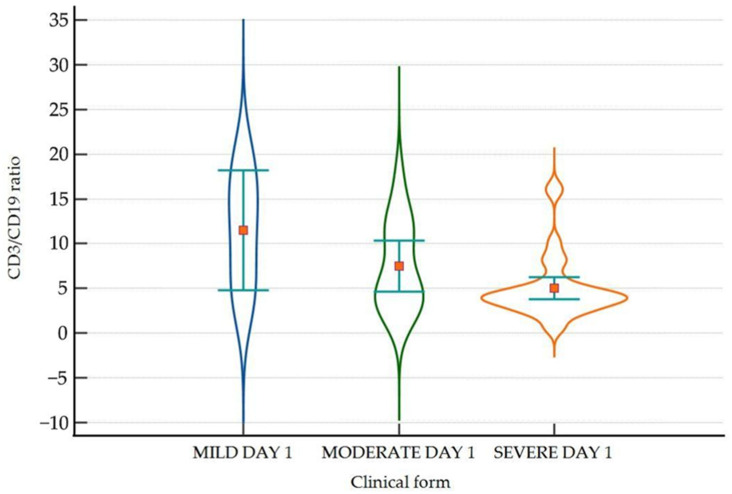
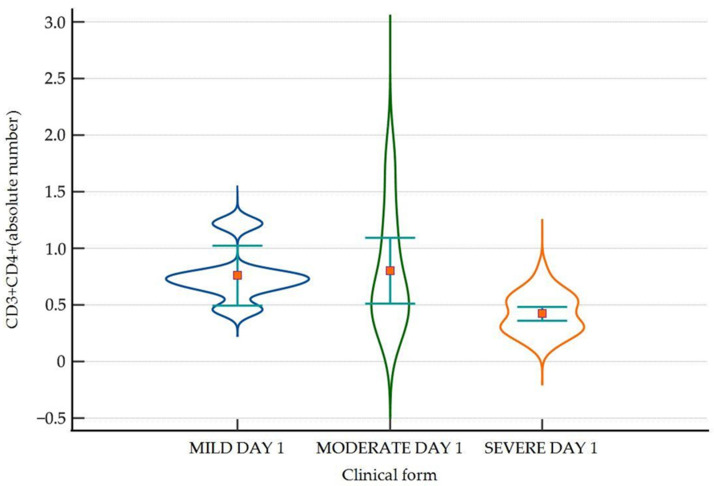
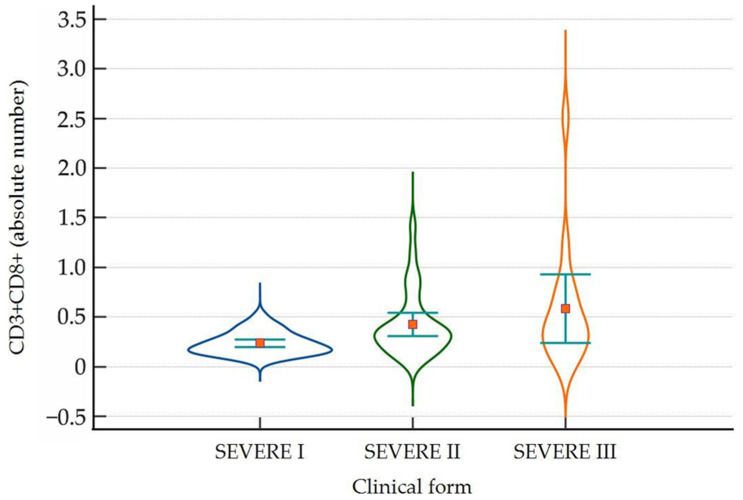
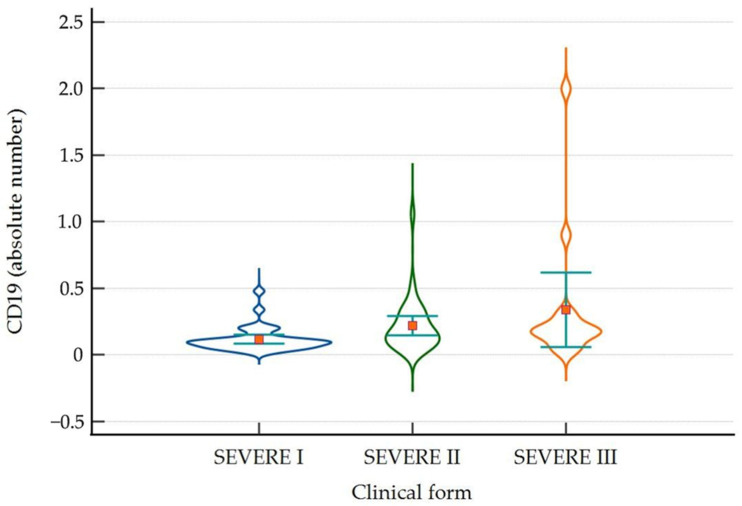
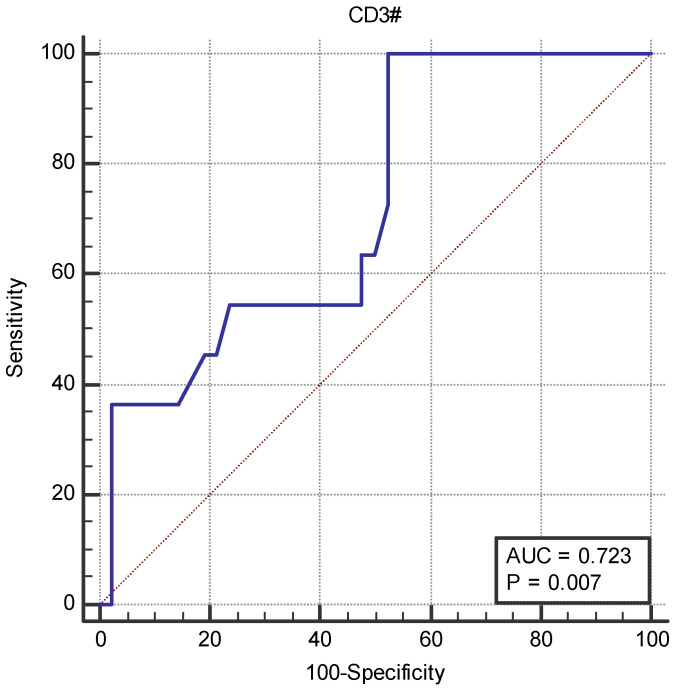
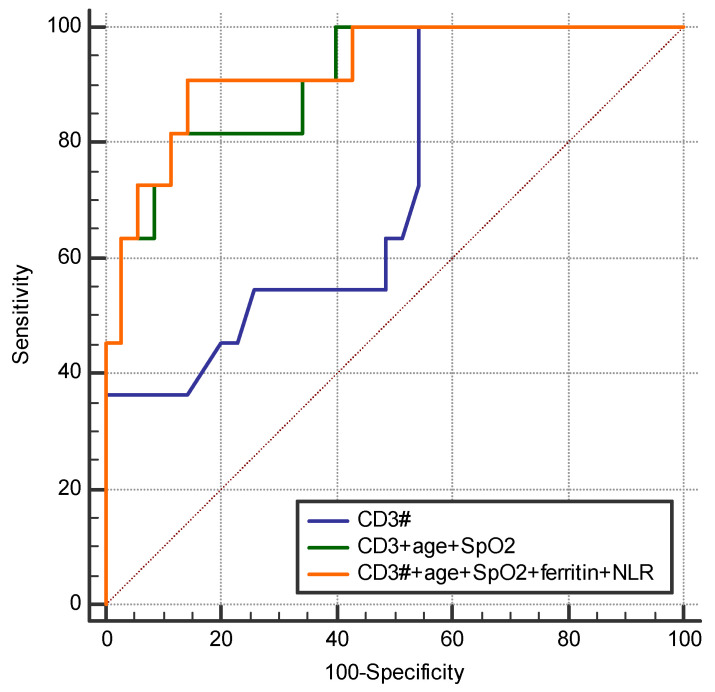
Studies suggest that the dynamic changes in cellular response might correlate with disease severity and outcomes in SARS-CoV-2 patients. The study aimed to investigate the dynamic changes of lymphocyte subsets in patients with COVID-19. In this regard, 53 patients with COVID-19 were prospectively included, classified as mild, moderate, and severe. The peripheral lymphocyte profiles (LyT, LyB, and NK cells), as well as CD4+/CD8+, CD3+/CD19+, CD3+/NK and CD19+/NK ratios, and their dynamic changes during hospitalization and correlation with disease severity and outcome were assessed. We found significant differences in CD3+ lymphocytes between severity groups (p < 0.0001), with significantly decreased CD3+CD4+ and CD3+CD8+ in patients with severe disease (p < 0.0001 and p = 0.048, respectively). Lower CD3+/CD19+ and CD3+/NK ratios among patients with severe disease (p = 0.019 and p = 0.010, respectively) were found. The dynamic changes of lymphocyte subsets showed a significant reduction in NK cells (%) and a significant increase in CD3+CD4+ and CD3+CD8+ cells in patients with moderate and severe disease. The ROC analysis on the relationship between CD3+ cells and fatal outcome yielded an AUC of 0.723 (95% CI 0.583-0.837; p = 0.007), while after addition of age and SpO2, ferritin and NLR, the AUC significantly improved to 0.927 (95%CI 0.811-0.983), p < 0.001 with a sensitivity of 90.9% (95% CI 58.7-99.8%) and specificity of 85.7% (95% CI 69.7-95.2%). The absolute number of CD3+ lymphocytes might independently predict fatal outcomes in COVID-19 patients and T-lymphocyte subset evaluation in high-risk patients might be useful in estimating disease progression.
Keywords: COVID-19; SARS-CoV-2; dynamic changes; lymphocyte profiles; outcome.
Conflict of interest statement
The authors declare no conflicts of interest.
Figures
References
-
- COVID-19 Deaths|WHO COVID-19 Dashboard. [(accessed on 19 August 2024)]. Available online: https://data.who.int/dashboards/covid19/deaths.
-
- Briciu V., Topan A., Calin M., Dobrota R., Leucuta D.-C., Lupse M. Comparison of COVID-19 Severity in Vaccinated and Unvaccinated Patients during the Delta and Omicron Wave of the Pandemic in a Romanian Tertiary Infectious Diseases Hospital. Healthcare. 2023;11:373. doi: 10.3390/healthcare11030373. - DOI - PMC - PubMed
MeSH terms
Grants and funding
LinkOut - more resources
Full Text Sources
Medical
Research Materials
Miscellaneous
