. 2024 Nov 6;25(22):11924.
doi: 10.3390/ijms252211924.

DLK1 Is Associated with Stemness Phenotype in Medullary Thyroid Carcinoma Cell Lines

Affiliations

DLK1 Is Associated with Stemness Phenotype in Medullary Thyroid Carcinoma Cell Lines

Danilo Dias da Silva et al. Int J Mol Sci. .

Abstract

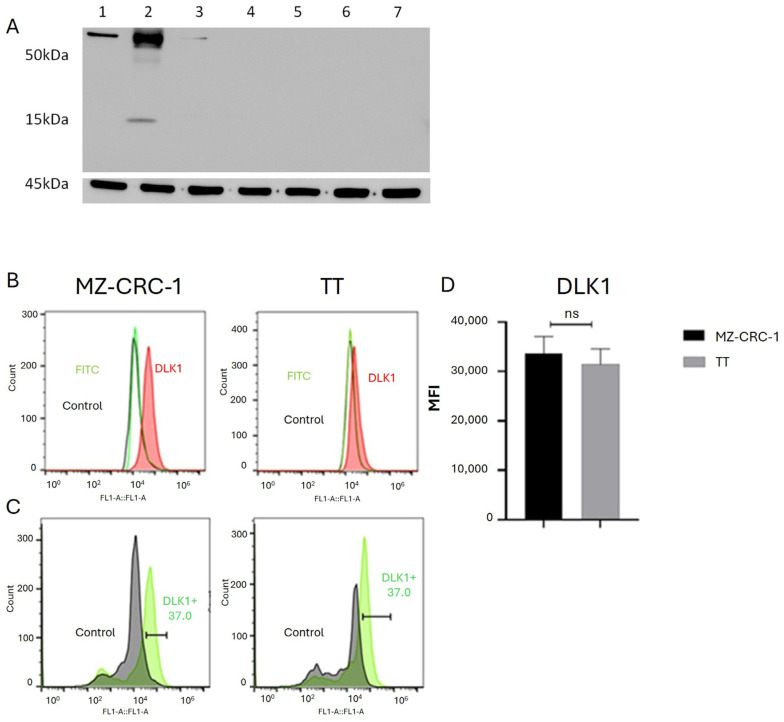
Medullary thyroid carcinoma (MTC) is a rare and aggressive tumor, often requiring systemic treatment in advanced or metastatic stages, where drug resistance presents a significant challenge. Given the role of cancer stem cells (CSCs) in cancer recurrence and drug resistance, we aimed to identify CSC subpopulations within two MTC cell lines harboring pathogenic variants in the two most common MEN2-associated codons. We analyzed 15 stemness-associated markers, along with well-established thyroid stem cell markers (CD133, CD44, and ALDH1), a novel candidate (DLK1), and multidrug resistance proteins (MRP1 and MRP3). The ability to efflux the fluorescent dye Hoechst 3342 and form spheroids, representing CSC behavior, was also assessed. MZ-CRC-1 cells (p.M918T) displayed higher expressions of canonical markers, DLK1, and MRP proteins than TT cells (p.C634W). MZ-CRC-1 cells also formed more spheroids and showed less dye accumulation (p < 0.0001). Finally, we observed that DLK1+ cells (those expressing DLK1) in both cell lines exhibited significantly higher levels of stemness markers compared to DLK1- cells (those lacking DLK1 expression). These findings underscore DLK1's role in enhancing the stemness phenotype, providing valuable insights into MTC progression and resistance and suggesting potential therapeutic implications.

Keywords: CD133; CD44; DLK1; RET; cancer stem cells; medullary thyroid carcinoma; p.M918T.


Conflict of interest statement

The authors declare that no conflicts of interest could be perceived as prejudicing the impartiality of the research reported.

Figures

Figure 1
Figure 1
The figure provides a comprehensive analysis of stem cell markers in medullary thyroid carcinoma (MTC) cell lines. (A) shows results from antibody array membrane analysis, while (B) displays a heatmap illustrating the differential expression of 15 analyzed proteins. Notably, the MZ-CRC-1 cell line, characterized by the RET p.M918T variant, shows elevated expression for most proteins associated with the stem cell phenotype compared to the TT cell line, characterized by the RET p.C634W variant. (C) FC was employed to assess the expression of recognized stem cell markers (OCT3/4, SOX2, NANOG) in MZ-CRC-1 and TT cell lines. Representative histograms illustrate the red peak indicating target protein expression, distinctly separated from the green peak (secondary antibody) and black peak (negative control). (D) For FC analysis, two independent experiments were conducted in triplicate. About 10,000 events were recorded and reported as median fluorescence intensity (MFI). (E) FC indicates the percentage of MZ-CRC-1 and TT cells positive for OCT3/4 (40.3%, 26.5%), SOX2 (96.5%, 60.5%), and NANOG (63.8%, 1.7%). Statistical significance was determined using unpaired t-tests and denoted as follows: >0.05 (ns), ** p ≤ 0.01, and *** p ≤ 0.001.
Figure 2
Figure 2
The figure displays the FC analysis of ALDH1A1, CD44, and CD133. (A) shows representative histograms of ALDH1A1, CD44, and CD133 expression, with the red peak indicating target protein expression. This distinct shift separates it from the secondary antibody signal (green peak) and the negative control (black peak). For FC analysis, two independent experiments were conducted in triplicate. About 10,000 events were recorded and reported as median fluorescence intensity (MFI). (B) shows histograms illustrating the proportion of cells expressing the target protein (green peak), distinctly separated from the negative control (black peak). The percentage of MZ-CRC-1 and TT cells positive for ALDH1A1 (52.1%, 93%), CD44 (47.6%, 48.8%), and CD133 (18.2%, 1%) is shown. Statistical significance was determined using unpaired t-tests and denoted as follows: ** p ≤ 0.01, *** p ≤ 0.001, and **** p ≤ 0.0001.
Figure 3
Figure 3
(A) The upper panel presents representative Western blot results showing DLK1 expression in TT (line 1) and MZ-CRC-1 (line 2) cells, as well as in non-medullary thyroid cell lines FTC133, BCPAP, XTC.UC1, KTC2, and 8505 (lines 3–7). β-actin was used as a loading control in the lower panel. (B) Representative histograms from FC analysis depict DLK1 expression in MZ-CRC-1 and TT cells. The red peak in the histograms indicates DLK1 protein expression, clearly distinguishable from the secondary antibody signal (green peak) and the negative control (black peak). (C) illustrates the proportion of cells expressing DLK1 in MZ-CRC-1 (37%) and TT cells (34.5%). (D) FC analysis was performed in triplicate across two independent experiments, and median fluorescence intensity (MFI) was reported. Statistical significance was assessed using unpaired t-tests and is denoted as >0.05 (ns).
Figure 4
Figure 4
The figure depicts the FC analysis of MRP1 and MRP3 and spheroid formation in MTC cells. (A) Representative histograms from FC analysis illustrate the red peak indicating target protein expression, distinctly separated from the green peak (secondary antibody) and black peak (negative control). FC analysis was performed in triplicate across two independent experiments, and median fluorescence intensity (MFI) was reported. (B) illustrates the concentration of Hoechst 33342 dye in cell supernatant at specified time points. Two independent experiments were conducted in triplicate. (C) The images illustrate representative examples of spheroid formation in MTC cells captured at distinct time points (24 h and 48 h after plating). The arrow highlights one of the multiple spheroids visible in the image. (D) Two independent experiments were conducted in triplicate. The total numbers of multicellular spheroids at each time point are graphically represented. Statistical significance was assessed using an unpaired t-test (* p < 0.05, *** p < 0.001, **** p < 0.0001).
Figure 5
Figure 5
The figures illustrates the forward- (FCS) and side- (SSC) scatter density plots of MZ-CRC-1 (A) and TT cell (C) lines sorted by DLK1 expression, either positive (DLK1+) or negative (DLK1−) (light blue). Size (FSC) and granularity (SSC) were smaller in DLK1+ (dark Blue) than (DLK1−) (light blue) cells. The FSC versus SSC plot is showed. (B,D) The bar chart presents the mean cell size of each population, highlighting that the DLK1+ subpopulation (P2) exhibits significantly smaller size compared to DLK1− subpopulation (P3) (** p ≤ 0.01, *** p < 0.001).
Figure 6
Figure 6
(A) presents results from an antibody array membrane analysis comparing DLK1-positive (DLK1+) and DLK1negative (DLK1−) subpopulations from the MZ-CRC-1 and TT cell lines. (B) displays a heatmap illustrating the differential expression of 15 analyzed proteins between the DLK1+ and DLK1− subpopulations (see Table 2).
Figure 7
Figure 7
This figure presents the analysis of stem cell markers in DLK1-positive (DLK1+) compared to DLK1-negative (DLK1−) subpopulations in both MZ-CRC-1 (A) and TT (B) cell lines. The data presented in Table 2 were log-transformed, and a histogram was generated using RStudio software to compare the relative expression levels between DLK1+ and DLK1− cells in both cell lines. The bar chart depicts the fold change (log2) on the y-axis, highlighting 15 stemness markers. Proteins significantly upregulated in the DLK1+ subpopulation are represented in light gray, while those showing downregulation are depicted in darker gray or black for each cell line.

References

    1. American Thyroid Association Guidelines Task Force. Kloos R.T., Eng C., Evans D.B., Francis G.L., Gagel R.F., Gharib H., Moley J.F., Pacini F., Ringel M.D., et al. Medullary thyroid cancer: Management guidelines of the American Thyroid Association. Thyroid. 2009;19:565–612. doi: 10.1089/thy.2008.0403. Erratum in Thyroid 2009, 19, 1295. - DOI - PubMed
    1. Wells S.A., Jr., Asa S.L., Dralle H., Elisei R., Evans D.B., Gagel R.F., Lee N., Machens A., Moley J.F., Pacini F., et al. Revised American Thyroid Association guidelines for the management of medullary thyroid carcinoma. Thyroid. 2015;25:567–610. doi: 10.1089/thy.2014.0335. - DOI - PMC - PubMed
    1. Cerutti J.M., Maciel R.M. An unusual genotype-phenotype correlation in MEN 2 patients: Should screening for RET double germline mutations be performed to avoid misleading diagnosis and treatment? Clin. Endocrinol. 2013;79:591–592. doi: 10.1111/cen.12155. - DOI - PubMed
    1. Araujo A.N., Moraes L., França M.I., Hakonarson H., Li J., Pellegrino R., Maciel R.M., Cerutti J.M. Genome-wide copy number analysis in a family with p.G533C RET mutation and medullary thyroid carcinoma identified regions potentially associated with a higher predisposition to lymph node metastasis. J. Clin. Endocrinol. Metab. 2014;99:E1104–E1112. doi: 10.1210/jc.2013-2993. - DOI - PubMed
    1. Signorini P.S., França M.I., Camacho C.P., Lindsey S.C., Valente F.O., Kasamatsu T.S., Machado A.L., Salim C.P., Delcelo R., Hoff A.O., et al. A ten-year clinical update of a large RET p.Gly533Cys kindred with medullary thyroid carcinoma emphasizes the need for an individualized assessment of affected relatives. Clin. Endocrinol. 2014;80:235–245. doi: 10.1111/cen.12264. - DOI - PubMed

MeSH terms

Substances

Supplementary concepts