. 2024 Nov 10;25(22):12062.
doi: 10.3390/ijms252212062.

Unveiling Biomarkers in Head and Neck Squamous Cell Carcinoma through Bioinformatics: The Role of SPP1 and KRT78

Affiliations

Unveiling Biomarkers in Head and Neck Squamous Cell Carcinoma through Bioinformatics: The Role of SPP1 and KRT78

Jaehwan Cheon et al. Int J Mol Sci. .

Abstract

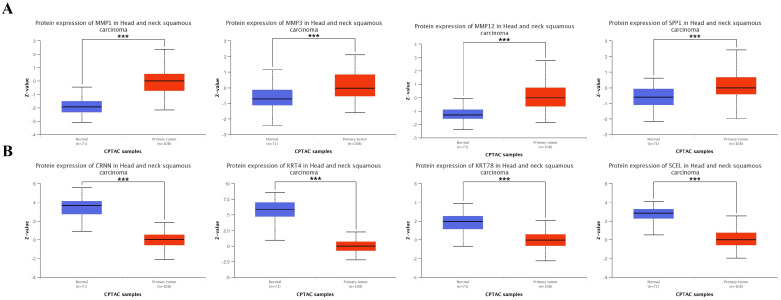
Head and neck squamous cell carcinoma (HNSCC) is the most common form of head and neck cancer, ranking sixth in global cancer incidence. Identifying molecular drivers of tumorigenesis and metastasis is essential for early detection and treatment. This study analyzed gene expression profiles from three datasets (GSE6791, GSE29330, and GSE58911) to identify differentially expressed genes (DEGs) in HNSCC. Gene Ontology and Kyoto Encyclopedia of Genes and Genomes pathway analyses were employed to functionally annotate these DEGs. A protein-protein interaction (PPI) network was constructed for selecting hub genes using the STRING database. Finally, hub gene and protein expression levels were evaluated in patients with HNSCC, along with their association with overall survival. Our analysis identified twenty-eight co-DEGs comprising eight up-regulated and twenty down-regulated genes, primarily involved in extracellular matrix (ECM) organization, proteolysis, ECM disassembly, and keratinization processes. Furthermore, the PPI network revealed eight hub genes based on their high degree of connectivity. Notably, SPP1 demonstrated up-regulation, while KRT78 was down-regulated in HNSCC. Remarkably, the expression levels of these hub genes correlated with tumor grade, clinical cancer stage, and poor prognosis in HNSCC. Our findings hold significant clinical potential for early diagnosis and the development of novel therapeutic targets for patients with HNSCC.

Keywords: KRT78; SPP1; bioinformatics; biomarker; head and neck squamous cell carcinoma.


Conflict of interest statement

The authors declare no conflicts of interest.

Figures

Figure 1
Figure 1
Differentially expressed gene (DEGs) and co-DEGs identification of head and squamous cell carcinoma (HNSCC) using three datasets. Volcano plots exhibiting all DEGs in each dataset (GSE6791, GSE29330, and GSE58911) are exhibited in (AC). In the volcano maps, the red points represent up-regulated genes that were screened based on fold change greater than or equal to 2.0 with a corrected p-value of less than 0.05. The blue points represent down-regulated genes that were screened based on fold change less than or equal to −2.0 and a corrected p-value of less than 0.05. Black points indicate genes with no significant differences. Heatmap plots representing the top twenty genes in each dataset (GSE6791, GSE29330, and GSE58911) are exhibited in (DF). In the heatmap plot, gene expression is visualized using color codes. Red indicates up-regulation, blue indicates down-regulation, and white indicates no significant change. (G) Eight up-regulated and (H) twenty down-regulated co-DEGs. Co-DEGs were identified by analyzing the cross-linking data in GSE6791, GSE29330, and GSE58911 using a Venn diagram.
Figure 2
Figure 2
Gene Ontology (GO) terminology and Kyoto Encyclopedia of Genes and Genomes (KEGG) analyses of up-regulated DEGs.: The GO analysis categorized the up-regulated DEGs from each dataset (GSE6791, GSE29330, and GSE58911) into distinct functional groups based on their roles, as shown in (AC). The KEGG analysis classified the up-regulated DEGs from each dataset (GSE6791, GSE29330, and GSE58911) into biochemical pathways according to their gene functions, as illustrated in (DF).
Figure 3
Figure 3
GO and KEGG analyses of down-regulated DEGs. The GO analysis categorized the down-regulated DEGs from each dataset (GSE6791, GSE29330, and GSE58911) into distinct functional groups based on their roles, as shown in (AC). The KEGG analysis classified the down-regulated DEGs from each dataset (GSE6791, GSE29330, and GSE58911) into biochemical pathways according to their gene functions, as illustrated in (DF).
Figure 4
Figure 4
GO and KEGG analyses of co-DEGs. GO analysis (A) and KEGG pathway analysis (B) of co-DEGs. GO and KEGG pathway analyses classify co-DEGs into some functional groups and biochemical pathways based on gene character.
Figure 5
Figure 5
Protein–protein interaction (PPI) network of co-DEGs. Circles represent genes, and lines represent protein interactions. The results within the circles represent the protein structure. The line color represents the evidence of an interaction.
Figure 6
Figure 6
Hub genes mRNA expression in patients with HNSCC within The Cancer Genome Atlas (TCGA) database. The mRNA expression of all hub genes was significantly altered in HNSCC primary tumors compared to normal tissues. All up-regulated hub genes, including MMP1, MMP3, MMP12, and SPP1, were part of eight up-regulated co-DEGs identified in GSE6791, GSE29330, and GSE58911 (Top). Similarly, all down-regulated hub genes, including CRNN, KRT78, KRT4, and SCEL, were among the 20 down-regulated co-DEGs identified in the three datasets (Bottom). *** p-value < 0.001.
Figure 7
Figure 7
Hub genes mRNA expression based on individual cancer stage and tumor grade of patients with HNSCC. The mRNA expression of KRT78 and SPP1 significantly decreased and increased according to the tumor grade and individual cancer stages, respectively. * p-value < 0.05, ** p-value < 0.01, *** p-value < 0.001.
Figure 8
Figure 8
Hub genes protein expression in patients with HNSCC within Clinical Proteomic Tumor Analysis Consortium (CPTAC) database. The protein expression of all hub genes was significantly altered in HNSCC primary tumors compared with normal tissues. MMP1, MMP3, MMP12, and SPP1 were up-regulated (A), while CRNN, KRT78, KRT4, and SCEL were down-regulated in HNSCC (B), ***: p-value < 0.001.
Figure 9
Figure 9
Hub genes protein expression in HNSCC tumor and normal tissue. Immuno-histochemistry results from the Human Protein Atlas (HPA) database showed lower staining intensities for CRNN, KRT78, KRT4, and SCEL in HNSCC tumor tissues than in normal tissues.
Figure 10
Figure 10
Overall survival rate analysis of the identified hub genes. Overall survival rates according to SPP1 (A) and KRT78 expression (B) in patients with HNSCC. High SPP1 expression is associated with a high hazard ratio (HR) and decreased survival rate, while low KRT78 expression is involved in decreased survival rates.

Similar articles

Cited by

References

    1. Bhat G.R., Hyole R.G., Li J. Advances in Cancer Research. Vol. 152. Elsevier; Amsterdam, The Netherlands: 2021. Head and Neck Cancer: Current Challenges and Future Perspectives; pp. 67–102. - PubMed
    1. Cui J., Zheng L., Zhang Y., Xue M. Bioinformatics Analysis of DNMT1 Expression and Its Role in Head and Neck Squamous Cell Carcinoma Prognosis. Sci. Rep. 2021;11:2267. doi: 10.1038/s41598-021-81971-5. - DOI - PMC - PubMed
    1. Johnson D.E., Burtness B., Leemans C.R., Lui V.W.Y., Bauman J.E., Grandis J.R. Head and Neck Squamous Cell Carcinoma. Nat. Rev. Dis. Prim. 2020;6:92. doi: 10.1038/s41572-020-00224-3. - DOI - PMC - PubMed
    1. Sung H., Ferlay J., Siegel R.L., Laversanne M., Soerjomataram I., Jemal A., Bray F. Global Cancer Statistics 2020: GLOBOCAN Estimates of Incidence and Mortality Worldwide for 36 Cancers in 185 Countries. CA Cancer J. Clin. 2021;71:209–249. doi: 10.3322/caac.21660. - DOI - PubMed
    1. MICHA R. Checkpoint Immunotherapy in Head and Neck Cancers. Physiol. Behav. 2017;176:100–106. doi: 10.1177/0022146515594631. - DOI

MeSH terms