. 2024 Nov 12;25(22):12130.
doi: 10.3390/ijms252212130.

Transcriptomic Changes During the Replicative Senescence of Human Articular Chondrocytes

Affiliations

Transcriptomic Changes During the Replicative Senescence of Human Articular Chondrocytes

Aysegul Atasoy-Zeybek et al. Int J Mol Sci. .

Abstract

Aging is a major risk factor for osteoarthritis (OA), but the specific mechanisms connecting aging and OA remain unclear. Although chondrocytes rarely divide in adult articular cartilage, they undergo replicative senescence in vitro, offering a model to study aging-related changes under controlled conditions. OA cartilage was obtained from an 80-year-old male and a 72-year-old female, while normal cartilage was sourced from a 26-year-old male. Chondrocyte cultures were established and sub-cultured to their Hayflick limit. Bulk RNA sequencing on early- and late-passage human articular chondrocytes identified transcriptomic changes associated with cellular aging. Early-passage OA chondrocytes already showed senescent phenotypes, unlike normal chondrocytes. All three cultures underwent 30 population doublings before replicative exhaustion, at which point all cells displayed senescence. During this process, cells lost their ability to form cartilaginous pellets. Differential gene expression analysis revealed distinct transcriptomic profiles between early- and late-passage chondrocytes and between normal and OA-derived cells. Genes related to matrix synthesis, degradation, inflammation, and the senescence-associated secretory phenotype (SASP) showed significant expression changes. Despite being a small pilot study, these findings suggest that further research into the molecular and metabolic changes during chondrocyte senescence could provide valuable insights into OA pathobiology.

Keywords: Hayflick limit; aging; chondrocyte replicative senescence; osteoarthritis; transcriptomics.


Conflict of interest statement

The authors declare no conflicts of interest.

Figures
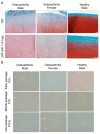
Figure 1
Figure 1
Histological analysis of cartilage samples and effect of serial passaging on cell morphology. (A) Safranin O/fast green staining for osteoarthritis, male cartilage; osteoarthritis, female cartilage; healthy male cartilage. Scale bars: 100 µm with 10× objective; 50 µm with 20× objective, 1.6 magnification. (B) Cell morphology analysis of early-, middle-, and late-passage chondrocytes from male osteoarthritis, female osteoarthritis, and healthy male. The first horizontal row shows early-passage chondrocytes, the second horizontal row displays middle passage, and the third horizontal row exhibits late-passage chondrocytes. Scale bars: 50 µm with 20× obj.
Figure 2
Figure 2
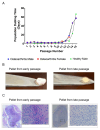
Effect of serial passaging on doubling time and chondrogenesis. (A) The population doubling time (days) for cell passages 1 to 15 in osteoarthritis male, female, and healthy male cell populations. (B) Effects of replicative senescence on appearance of chondrocyte pellet cultures (C) Effects of replicative senescence on toluidine blue staining of chondrocyte pellets. Scale bar: 200 µm with 4× objective and 50 µm with 20× objective.
Figure 3
Figure 3
Bulk RNA sequencing analysis of osteoarthritis and healthy group. (A) Principal component analysis (PCA) indicating differential expression pattern between osteoarthritic and healthy cells (the early-passage healthy male sample “a” was excluded from the analysis as it was identified as an outlier in comparison to its paired sample “b”). (B) Heatmap illustrating upregulated (shown as red) and downregulated (shown as green) genes in the osteoarthritic vs. healthy chondrocytes. (_a, _b) are duplicates from the same sample. (C) Volcano plot displaying differences in gene expression between osteoarthritic and healthy chondrocytes. Red dots represent significantly differentially expressed genes (DEGs) that have an absolute fold change (FC) of ≥2, green dots represent genes that have an absolute FC of ≤2, and black dots represent genes not differentially expressed. The FC presented here is the gene expression of osteoarthritis relative to healthy controls. (D) Tables showing the most up-/downregulated genes. (E) Basic pathway analysis revealing alterations in key pathways linked to aging in osteoarthritis, showing up-/downregulated pathways.
Figure 4
Figure 4
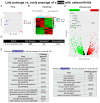
Bulk RNA sequencing analysis of late- and early-passage chondrocytes from a male with osteoarthritis. (A) Principal component analysis (PCA) indicating differential expression pattern between late- and early-passage cells. (B) Heatmap depicting upregulated (shown as red) and downregulated (shown as green) genes in the late passage vs. early passage of chondrocytes. (_a, _b) are duplicates from the same sample. (C) Volcano plot highlighting differences in gene expression between late-passage and early-passage chondrocytes. Red dots represent significantly differentially expressed genes (DEGs) that have an absolute fold change (FC) of ≥2, green dots represent genes that have an absolute FC of ≤2, and black dots represent genes not differentially expressed. The FC presented here is the gene expression of late passages relative to early passages. (D) Tables showing up-/downregulated genes. (E) Basic pathway analysis revealing alterations in key pathways linked to aging in late passage, showing up-/downregulated pathways.
Figure 5
Figure 5
Bulk RNA sequencing analysis of late- and early-passage chondrocytes from a female with osteoarthritis. (A) Principal component analysis (PCA) indicating differential expression pattern between late- and early-passage cells. (B) Heatmap depicting upregulated (shown as red) and downregulated (shown as green) genes in the late passage vs. early passage of chondrocytes. (_a, _b) are duplicates from the same sample. (C) Volcano plot highlighting differences in gene expression between late-passage and early-passage chondrocytes. Red dots represent significantly differentially expressed genes (DEGs) that have an absolute fold change (FC) of ≥2, green dots represent genes that have an absolute FC of ≤2, and black dots represent genes not differentially expressed. The FC presented here is the gene expression of late passages relative to early passages. (D) Tables showing up-/downregulated genes. (E) Basic pathway analysis revealing alterations in key pathways linked to aging in late passage, showing up-/downregulated pathways.
Figure 6
Figure 6
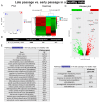
Bulk RNA sequencing analysis of late- and early-passage chondrocytes from a healthy male. (A) Principal component analysis (PCA) indicating differential expression pattern between late- and early-passage cells. (B) Heatmap depicting upregulated (shown as red) and downregulated (shown as green) genes in the late passage vs. early passage of chondrocytes. (_a, _b) are duplicates from the same sample. (C) Volcano plot highlighting differences in gene expression between late-passage and early-passage chondrocytes. Red dots represent significantly differentially expressed genes (DEGs) that have an absolute fold change (FC) of ≥2, green dots represent genes that have an absolute FC of ≤2, and black dots represent genes not differentially expressed. The FC presented here is the gene expression of late passages relative to early passages. (D) Tables showing up-/downregulated genes. (E) Basic pathway analysis revealing alterations in key pathways linked to aging in late passage, showing up-/downregulated pathways.
Figure 7
Figure 7
Expression of selected genes related to matrix turnover and senescence during serial passaging. DEGs encompassing (A) components of the extracellular matrix (ECM) and enzymes that degrade the ECM and (B) genes associated with the senescence-associated secretory phenotype (SASP). Gene fpkm: Fragments Per Kilobase per Million mapped reads.
Figure 8
Figure 8
Basic pathway analysis of differentially expressed genes in chondrocytes from males and females with osteoarthritis. (A) Venn diagram illustrating shared and distinct genes in males and females. (B) Top 20 pathways common between males and females with OA. (C) Top 20 pathways unique to males with OA. (D) Top 20 pathways unique to females with OA. Shades of orange indicate the most significantly regulated pathways, with darker shades representing higher levels of regulation and lighter shades indicating lower levels.
Figure 9
Figure 9
Measurement of key transcripts by qRT-PCR. Quantification of IL-1α, IL-1β, IL-6, p16INK4A, p21CIP1, and p53 using qRT-PCR (* p < 0.05; ** p < 0.01; *** p < 0.001; **** p < 0.0001).

Update of

Similar articles

Cited by

  • The intersection of aging and estrogen in osteoarthritis.
    Atasoy-Zeybek A, Showel KK, Nagelli CV, Westendorf JJ, Evans CH. Atasoy-Zeybek A, et al. NPJ Womens Health. 2025;3(1):15. doi: 10.1038/s44294-025-00063-1. Epub 2025 Feb 25. NPJ Womens Health. 2025. PMID: 40017990 Free PMC article. Review.

References

    1. Coaccioli S., Sarzi-Puttini P., Zis P., Rinonapoli G., Varrassi G. Osteoarthritis: New Insight on Its Pathophysiology. J. Clin. Med. 2022;11:6013. doi: 10.3390/jcm11206013. - DOI - PMC - PubMed
    1. Global, regional, and national burden of osteoarthritis, 1990-2020 and projections to 2050: A systematic analysis for the Global Burden of Disease Study 2021. Lancet Rheumatol. 2023;5:e508–e522. doi: 10.1016/S2665-9913(23)00163-7. - DOI - PMC - PubMed
    1. Long H., Liu Q., Yin H., Wang K., Diao N., Zhang Y., Lin J., Guo A. Prevalence Trends of Site-Specific Osteoarthritis From 1990 to 2019: Findings From the Global Burden of Disease Study 2019. Arthritis Rheumatol. 2022;74:1172–1183. doi: 10.1002/art.42089. - DOI - PMC - PubMed
    1. Palazzo C., Nguyen C., Lefevre-Colau M.M., Rannou F., Poiraudeau S. Risk factors and burden of osteoarthritis. Ann. Phys. Rehabil. Med. 2016;59:134–138. doi: 10.1016/j.rehab.2016.01.006. - DOI - PubMed
    1. Segal N.A., Nilges J.M., Oo W.M. Sex differences in osteoarthritis prevalence, pain perception, physical function and therapeutics. Osteoarthr. Cartil. 2024;32:1045–1053. doi: 10.1016/j.joca.2024.04.002. - DOI - PubMed