. 2024 Nov 13;25(22):12158.
doi: 10.3390/ijms252212158.

PKCα Activation via the Thyroid Hormone Membrane Receptor Is Key to Thyroid Cancer Growth

Affiliations

PKCα Activation via the Thyroid Hormone Membrane Receptor Is Key to Thyroid Cancer Growth

Mateo N Campos Haedo et al. Int J Mol Sci. .

Abstract

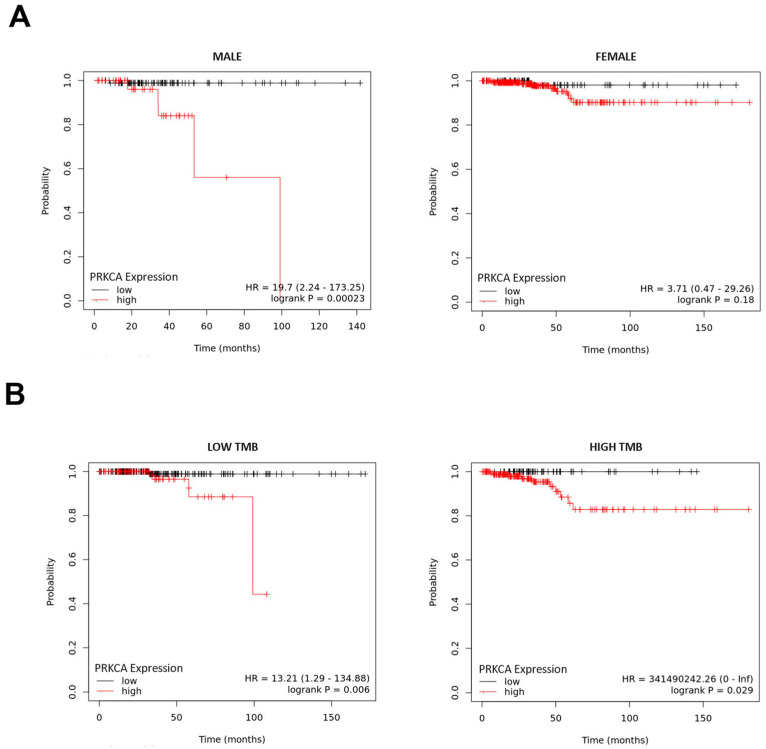
Thyroid carcinoma (TC) is the most common endocrine neoplasia, with its incidence increasing in the last 40 years worldwide. The determination of genetic and/or protein markers for thyroid carcinoma could increase diagnostic precision. Accumulated evidence shows that Protein kinase C alpha (PKCα) contributes to tumorigenesis and therapy resistance in cancer. However, the role of PKCα in TC remains poorly studied. Our group and others have demonstrated that PKCs can mediate the proliferative effects of thyroid hormones (THs) through their membrane receptor, the integrin αvβ3, in several cancer types. We found that PKCα is overexpressed in TC cell lines, and it also appeared as the predominant expressed isoform in public databases of TC patients. PKCα-depleted cells significantly reduced THs-induced proliferation, mediated by the integrin αvβ3 receptor, through AKT and Erk activation. In databases of TC patients, higher PKCα expression was associated with lower overall survival. Further analyses showed a positive correlation between PKCα and genes from the MAPK and PI3K-Akt pathways. Finally, immunohistochemical analysis showed abnormal upregulation of PKCα in human thyroid tumors. Our findings establish a potential role for PKCα in the control of hormone-induced proliferation that can be explored as a therapeutic and/or diagnostic target for TC.

Keywords: PKCα; integrin αvβ3; thyroid cancer (TC); thyroid hormones (THs).


Conflict of interest statement

The authors declare no conflicts of interest.

Figures

Figure 1
Figure 1
Protein kinase C alpha (PKCα) expression in thyroid cancer (TC) cells. (A) mRNA levels of PKCα, PKCδ, PKCε, and PKCζ were analyzed by qPCR in thyroid cells. Gene expression was normalized to the β2-microglobulin gene using the ΔΔCt method. Data are expressed as the mean S.E. of three independent experiments. * p < 0.05 and *** p < 0.0001 with respect to ORI cells. (B) (Upper panel) PKCα protein levels in ORI and epithelial TC cells as determined by Western blot analysis. β-tubulin was used as the loading control. Similar results were observed in 3 independent experiments. (Bottom panel) Densitometry analysis of PKCα with respect to β-tubulin. * p < 0.05: *** p < 0.0001 with respect to ORI cells.
Figure 2
Figure 2
Protein kinase C alpha (PKCα) expression in thyroid cancer (TC) patients. PKC mRNA expression levels of different types of TC were obtained from the Gene Expression Omnibus platform (GSE126729) using R2. (A) The expression of all PKC isoforms in TC (papillary PTC + follicular FTC + anaplastic ATC). (B) The expression of all PKC isoforms in ATC. (C) Representative immunohistochemical staining of PKCα in specimens from TC patients from the British Hospital of Buenos Aires, Argentina. (Upper panels), TC with high PKCα expression. (Bottom panels), TC with low PKCα expression. (Inset), An enhanced view of PKCα staining in a TC specimen.
Figure 3
Figure 3
The relationship between protein kinase C alpha (PKCα) expression levels and overall survival in thyroid cancer (TC) patients from a public database. RNA-seq data from the PanCancer Atlas corresponding to TC (TCGA-THCA) were used to analyze for overall survival (OS) through Kaplan–Meier curves. (A) (Left panel). Male TC patients with high expression of PKCα have a reduced OS than those with low expression (p < 0.001). (Right panel). Women TC patients with high expression of PKCα have a reduced OS than those with low expression (ns). (B) (Left panel). Patients with low tumor mutational burden (TMB) and high mRNA expression of PKCα have a reduced OS than those with low expression (p < 0.01). (Right panel). Patients with high TMB and high mRNA expression of PKCα have a reduced OS than those with low expression (p < 0.05). The red curve represents the survival rate of TC patients with high PKCα expression, and the black curve represents the survival rate of TC patients with low PKCα expression.
Figure 4
Figure 4
Protein kinase C alpha (PKCα) expression is correlated with MAPK and PI3K pathways in thyroid cancer (TC) patients. Correlation analysis performed on PanCancer Atlas data showed a positive correlation between PKCα and MAPK4 (S = 0.46) (A) and PIK3CG (S = 0.35) (B) using cBioPortal. (C) A bar graph of enriched terms from the top 750 genes most significantly correlated with PKCα in samples with PKCα expression above the median. Cancer-associated signaling pathway functions, including the MAPK cascade and PI3K-AKT signaling, are shown through Metascape analysis. Darker color of the bar associates with a lower p-value. (D) A network of enriched terms colored by pathway.
Figure 5
Figure 5
Protein kninase C (PKC)-mediated thyroid stimulating hormone (TSH) and thyroid hormones (THs) effects in thyroid cancer thyroid cancer (TC) cells. (A) TPC-1 cells were pretreated or not (Ctrol) with 1 μM staurosporine (STAU) or 5 μM GF109203X (GF) and then incubated with 10 mIU/mL TSH or 1 nM T33,5,3′-triiodo-L-thyronine (T3) and 100 nM L-thyroxine (T4) (physiological concentrations, THs) in combination for 48 h. A Cell Titer Blue assay determined the number of live cells at each dose. Data are shown as the mean ± SD. *** p < 0.0001 with respect to the control; §§§ p < 0.0001 with respect to TSH; and ## p < 0.005 and ### p < 0.0001 with respect to TH-treated cells. (B) TPC-1 cells were transfected with non-target siRNA (siNT) or PKCα siRNA (siPRKCA); the cells were serum starved and untreated (Ctrol) or treated with 10 mIU/mL TSH or 1 nM T3 and 100 nM T4 (physiological concentrations, THs) in combination for 48 h. Cell Titer Blue assay determined the number of live cells at each dose. Data are shown as the mean ± SD. *** p < 0.0001 with respect to the control; §§§ p < 0.0001 with respect to TSH; and ### p < 0.0001 with respect to TH-treated cells. Inset. TPC-1 cells transfected with siNT or siPRKCA probed with a PKCα specific antibody. β-tubulin was used as the loading control. Representative data from 1 of 3 independent experiments. (C) The expression levels of PCNA and cleaved caspase-3 of cells described in B were determined by Western blot analysis. β-tubulin was used as the loading control. Similar results were observed in 3 independent experiments. (D) TPC-1 cells were transfected as in B; the cells were then serum starved and untreated (control) or treated with 10 mIU/mL TSH or 1 nM T3 and 100 nM T4 (THs) for 10 min. Western blot analysis shows AKT and p42/44 MAPK phosphorylation levels. β-tubulin was used as the loading control. Similar results were observed in 3 independent experiments.
Figure 6
Figure 6
The combined treatment of 3,5,3′-triiodo-L-thyronine (T3) and L-thyroxine (T4) induces the proliferation of thyroid cancer (TC) cells through noncanonical thyroid hormones (THs) receptors. TPC-1, WRO, and 8505C cells were grown in the absence of FBS and then pretreated or not (control) with 4.5 μM Cilengitide (Cile) and then incubated with 1 nM T3 and 100 nM T4 in combination (physiological concentrations, THs) for 48 h by a Cell Titer Blue assay; the number of living cells was determined with each treatment. A commercial kit (Promega) was used as indicated by the manufacturer. The mean ± SD is shown. *** p < 0.0001 with respect to the control and ### p < 0.0001 with respect to THs and ns means not significant differences with respect to control.
Figure 7
Figure 7
Diagram illustrating protein kinase C alpha (PKCα)-mediated proliferation by thyroid hormones (THs) and thyroid stimulating hormone (TSH) in a thyroid cancer (TC) cell. Proposed mechanisms for PKCα-mediated TH and TSH effects in TC cells (TF: transcription factor).

References

    1. Siegel R.L., Miller K.D., Fuchs H.E., Jemal A. Cancer Statistics, 2021. CA Cancer J. Clin. 2021;71:7–33. doi: 10.3322/caac.21654. - DOI - PubMed
    1. Chou R., Dana T., Haymart M., Leung A.M., Tufano R.P., Sosa J.A., Ringel M.D. Active Surveillance Versus Thyroid Surgery for Differentiated Thyroid Cancer: A Systematic Review. Thyroid. 2022;32:351–367. doi: 10.1089/thy.2021.0539. - DOI - PMC - PubMed
    1. Kim J., Gosnell J.E., Roman S.A. Geographic influences in the global rise of thyroid cancer. Nat. Rev. Endocrinol. 2020;16:17–29. doi: 10.1038/s41574-019-0263-x. - DOI - PubMed
    1. Masaki C., Sugino K., Tanizawa Y., Nakamura K., Okada Y., Cai Z., Okamoto T. Multikinase Inhibitor Treatment Patterns for Advanced Thyroid Cancer in Japan: An Administrative Claims Database Study. Drugs Real World Outcomes. 2023;10:145–158. doi: 10.1007/s40801-022-00346-y. - DOI - PMC - PubMed
    1. Ragusa F., Ferrari S.M., Elia G., Paparo S.R., Balestri E., Botrini C., Patrizio A., Mazzi V., Guglielmi G., Foddis R., et al. Combination Strategies Involving Immune Checkpoint Inhibitors and Tyrosine Kinase or BRAF Inhibitors in Aggressive Thyroid Cancer. Int. J. Mol. Sci. 2022;23:5731. doi: 10.3390/ijms23105731. - DOI - PMC - PubMed

MeSH terms

LinkOut - more resources