. 2024 Nov 13;25(22):12188.
doi: 10.3390/ijms252212188.

Integrating Physiology, Transcriptome, and Metabolome Analyses Reveals the Drought Response in Two Quinoa Cultivars with Contrasting Drought Tolerance

Affiliations

Integrating Physiology, Transcriptome, and Metabolome Analyses Reveals the Drought Response in Two Quinoa Cultivars with Contrasting Drought Tolerance

Yang Wang et al. Int J Mol Sci. .

Abstract

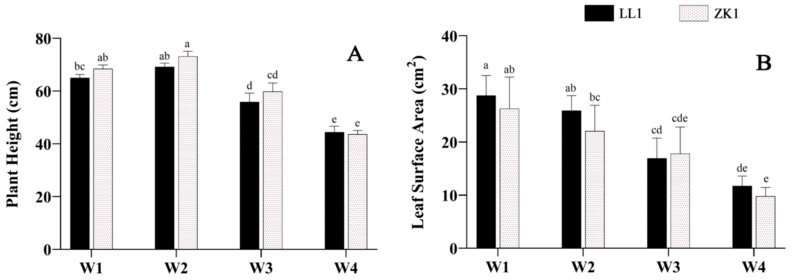
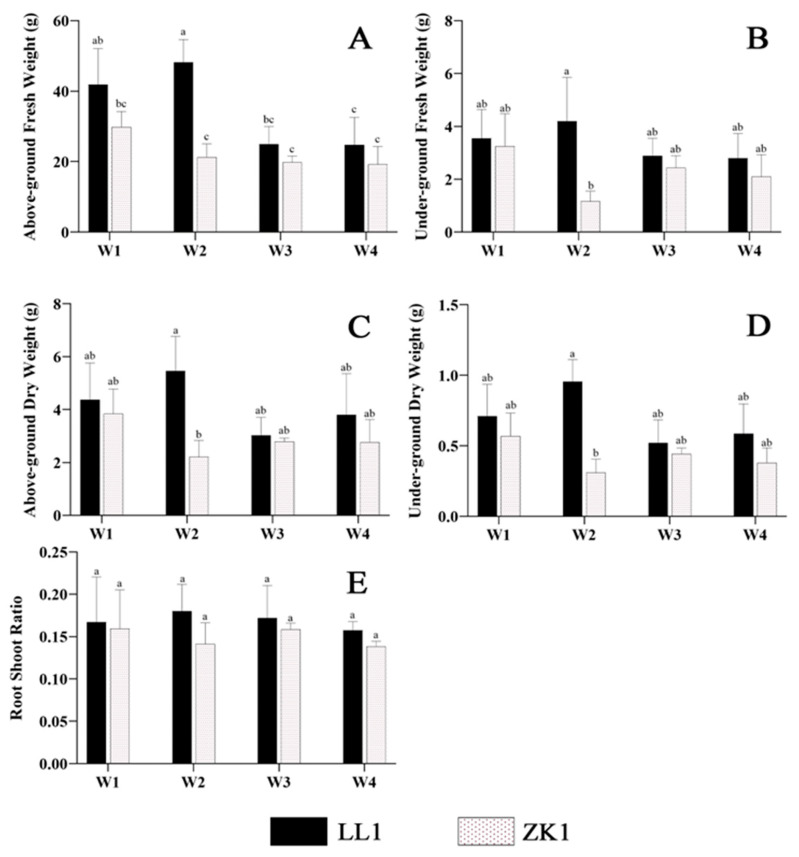
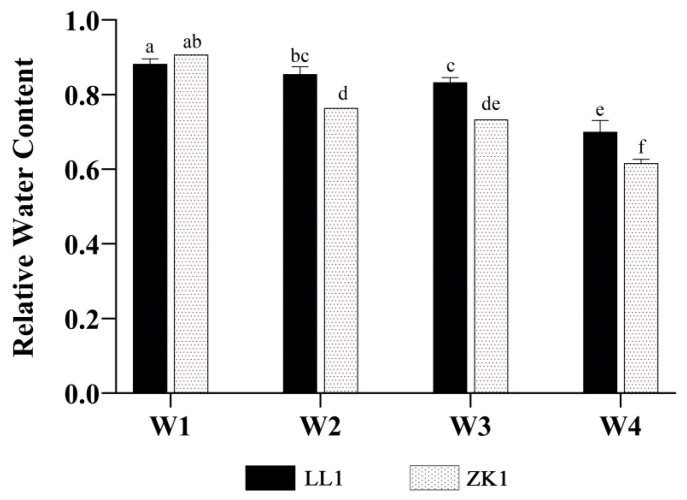
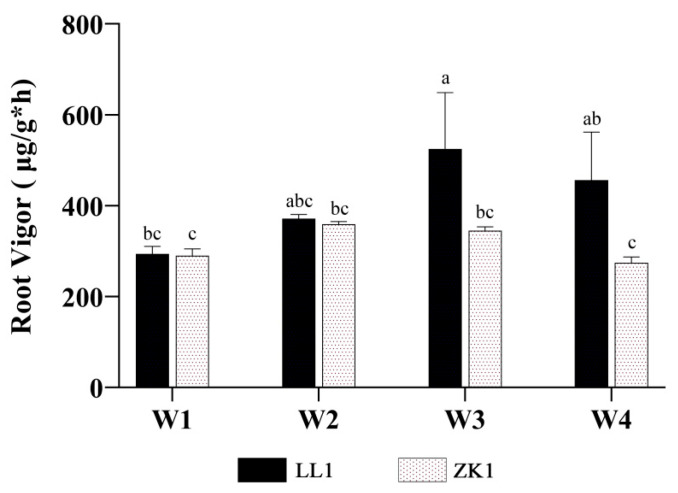
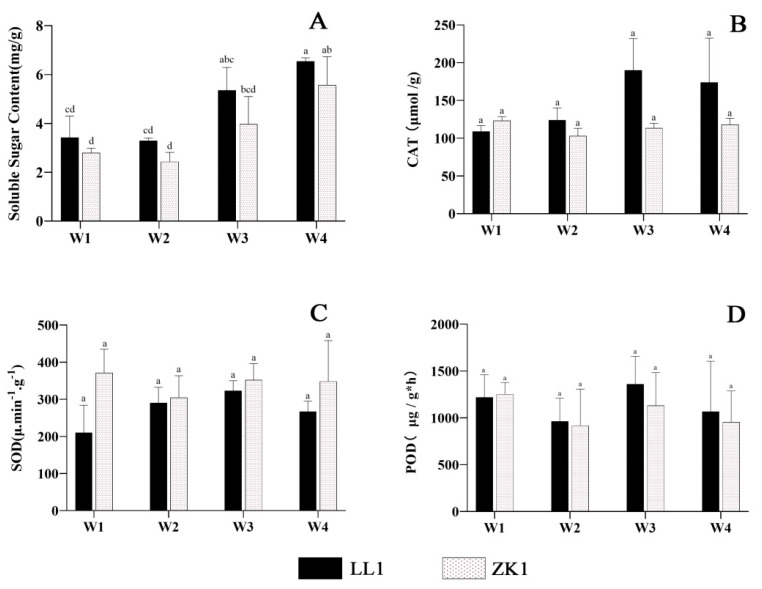
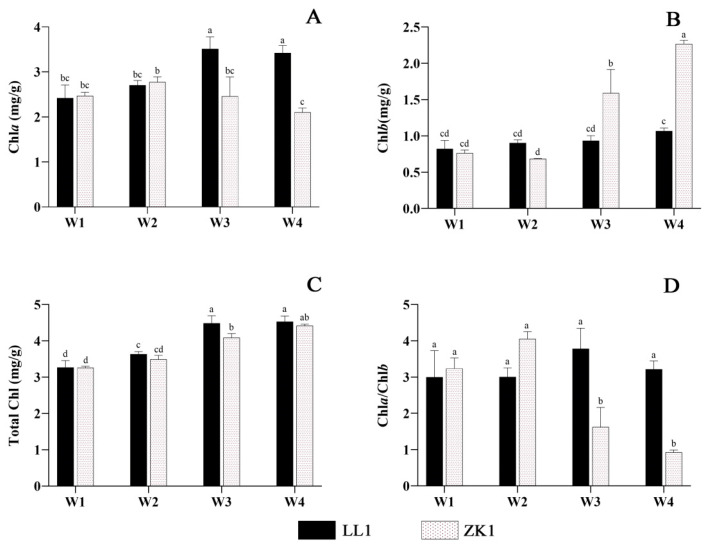
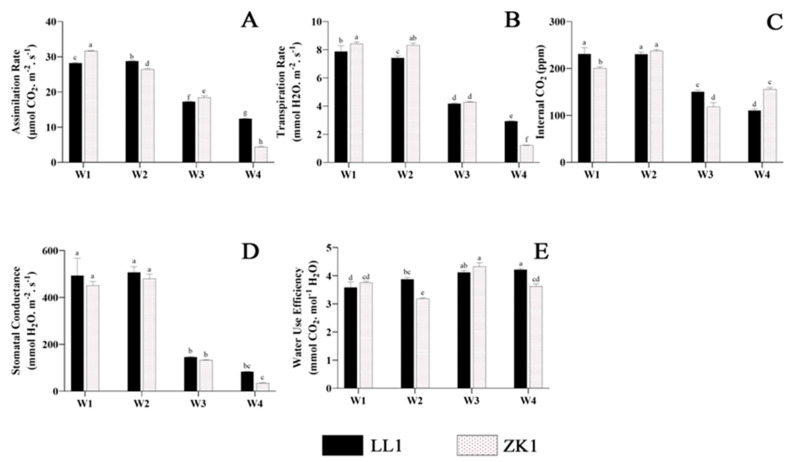
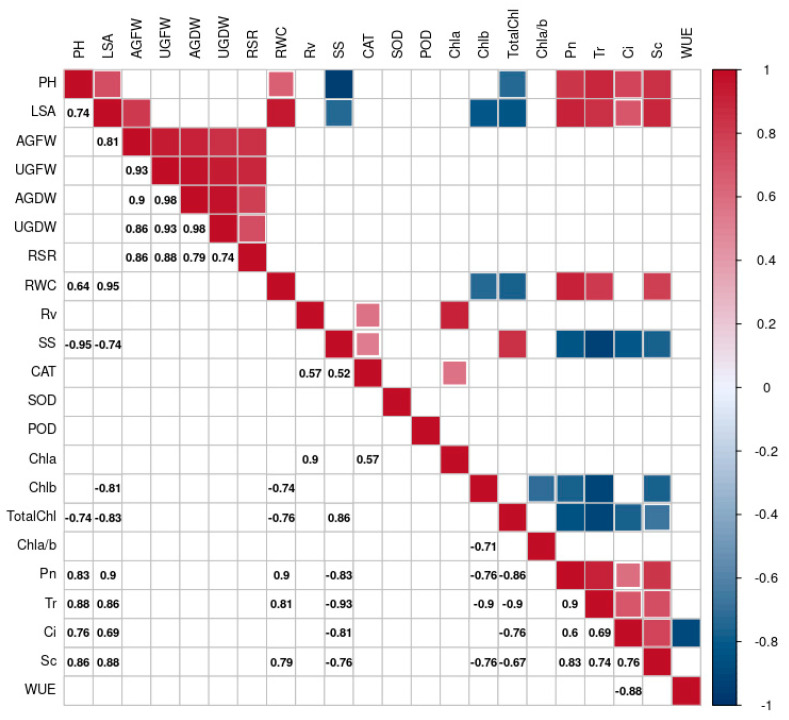
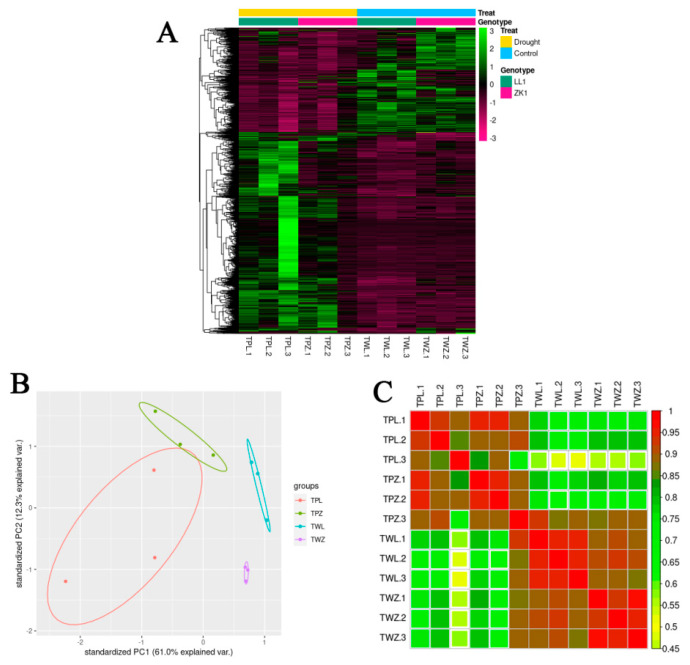
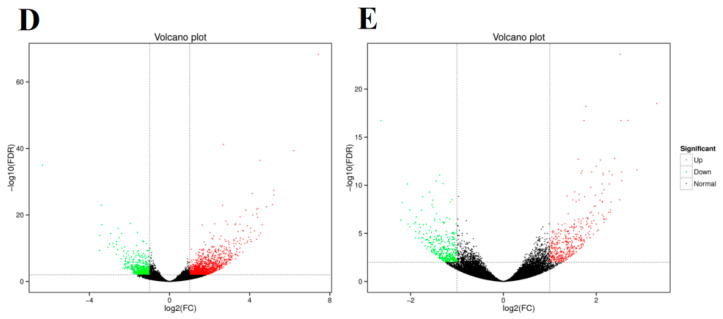
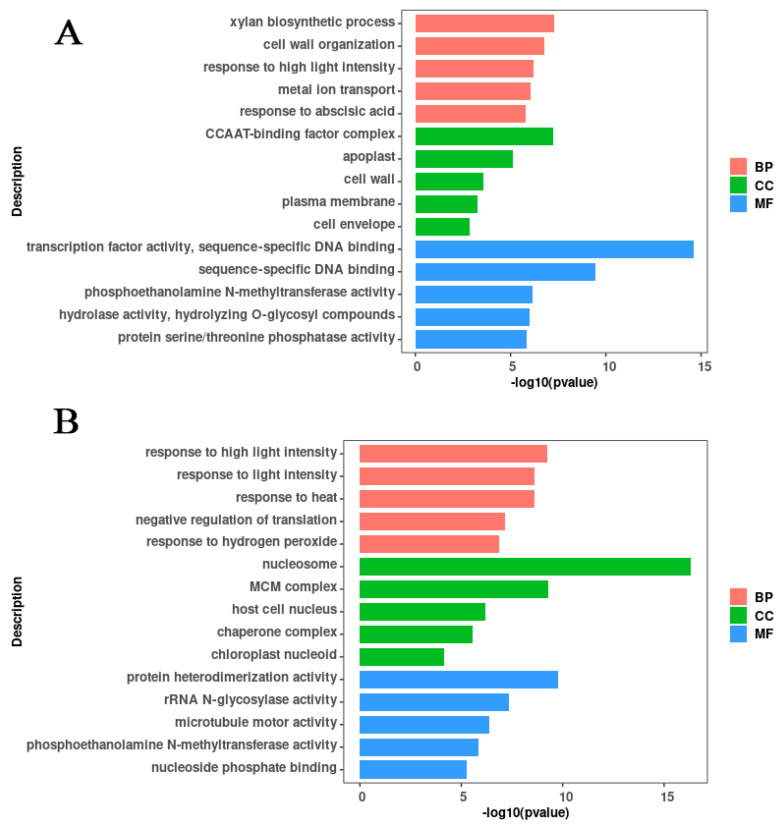
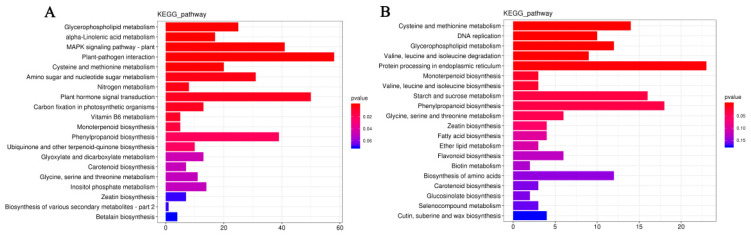
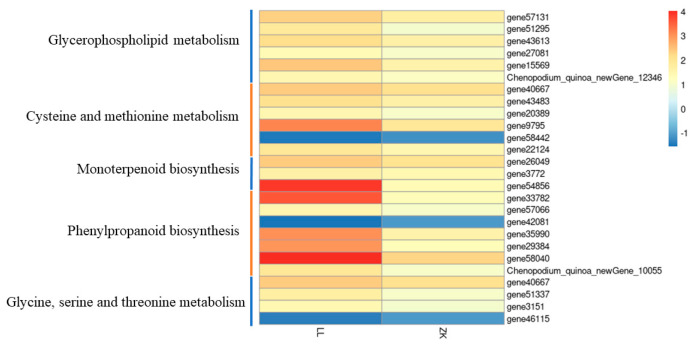
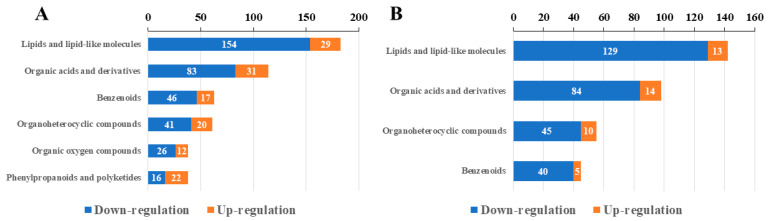
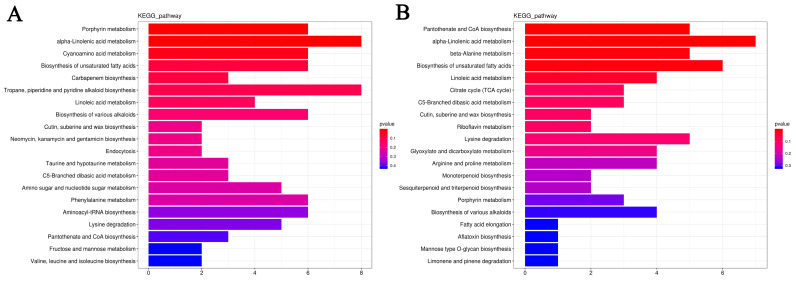
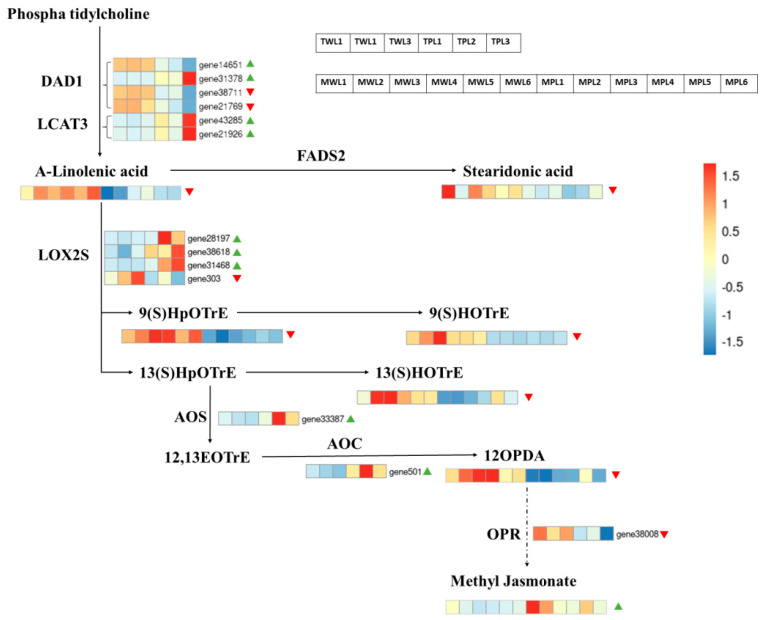
Quinoa (Chenopodium quinoa Willd.) is an annual broadleaf plant belonging to the Amaranthaceae family. It is a nutritious food crop and is considered to be drought-tolerant, but drought is still one of the most important abiotic stress factors limiting its yield. Quinoa responses to drought are related to drought intensity and genotype. This study used two different drought-responsive quinoa cultivars, LL1 (drought-tolerant) and ZK1 (drought-sensitive), to reveal the important mechanisms of drought response in quinoa by combining physiological, transcriptomic, and metabolomic analyses. The physiological analysis indicated that Chla/Chlb might be important for drought tolerance in quinoa. A total of 1756 and 764 differentially expressed genes (DEGs) were identified in LL1 and ZK1, respectively. GO (Gene Ontology) enrichment analysis identified 52 common GO terms, but response to abscisic acid (GO:0009737) and response to osmotic stress (GO:0006970) were only enriched in LL1. KEGG (Kyoto Encyclopedia of Genes and Genomes) analysis revealed that glycerophospholipid metabolism (ko00564) and cysteine and methionine metabolism (ko00270) ranked at the top of the list in both cultivars. A total of 1844 metabolites were identified by metabolomic analysis. "Lipids and lipid-like" molecules had the highest proportions. The DEMs in LL1 and ZK1 were mainly categorized 6 and 4 Human Metabolome Database (HMDB) superclasses, respectively. KEGG analysis revealed that the 'α-linolenic acid metabolism' was enriched in both LL1 and ZK1. Joint KEGG analysis also revealed that the 'α-linolenic acid metabolism' pathway was enriched by both the DEGs and DEMs of LL1. There were 17 DEGs and 8 DEMs enriched in this pathway, and methyl jasmonate (MeJA) may play an important role in the drought response of quinoa. This study will provide information for the identification of drought resistance in quinoa, research on the molecular mechanism of drought resistance, and genetic breeding for drought resistance in quinoa.

Keywords: Chla/Chlb; drought; methyl jasmonate; multi-omics; quinoa; α-linolenic acid metabolism.


Conflict of interest statement

The authors declare no conflict of interest.

Figures

Figure 1
Figure 1
The effects of different drought stress intensities on quinoa seedling height and leaf area. (A) Plant height. (B) Leaf surface area. Note: W1 represents control group, W2, W3, and W4 represent mild, moderate, and severe drought stress, respectively. The same as below. Vertical bars indicate the mean value ± SD (n = 3). The different lowercase letters indicate a significant difference (p < 0.05).
Figure 2
Figure 2
The effects of different drought stress intensities on quinoa biomass and root–shoot ratio. (A) The above-ground fresh weight (AGFW). (B) The under-ground fresh weight (UGFW). (C) The above-ground dry weight (AGDW). (D) The under-ground dry weight (UGDW). (E) The root–shoot ratio (RSR). Note: vertical bars indicate the mean value ± SD (n = 3). The different lowercase letters indicate a significant difference (p < 0.05).
Figure 3
Figure 3
The effects of different drought stress intensities on quinoa relative water content. Note: vertical bars indicate the mean value ± SD (n = 3). The different lowercase letters indicate a significant difference (p < 0.05).
Figure 4
Figure 4
The effects of different drought stress intensities on quinoa root vigor. Note: vertical bars indicate the mean value ± SD (n = 3). The different lowercase letters indicate a significant difference (p < 0.05).
Figure 5
Figure 5
The effects of different drought stress intensities on quinoa soluble sugars and antioxidase. (A) The soluble sugar content. (B) Enzymatic activity of CAT. (C) Enzymatic activity of SOD. (D) Enzymatic activity of POD. Note: vertical bars indicate the mean value ± SD (n = 3). The different lowercase letters indicate a significant difference (p < 0.05).
Figure 6
Figure 6
The effects of different drought stress intensities on quinoa chlorophyll. (A) Chlorophyll-a content. (B) Chlorophyll-b content. (C) Total chlorophyll. (D) Chlorophyll-a/chlorophyll-b. Note: vertical bars indicate the mean value ± SD (n = 3). The different lowercase letters indicate a significant difference (p < 0.05).
Figure 7
Figure 7
The effects of different drought stress intensities on quinoa photosynthetic properties. (A) The assimilation rate. (B) The transpiration rate. (C) The internal CO2 content. (D) Stomatal conductance. (E) Water use efficiency. Note: vertical bars indicate the mean value ± SD (n = 3). The different lowercase letters indicate a significant difference (p < 0.05).
Figure 8
Figure 8
Correlation analysis of physiological and biochemical indicators.
Figure 9
Figure 9
Gene expression clustering, principal components analysis (PCA), and correlation analysis. (A) Cluster analysis of gene expression. (B) Principle components analysis. (C) Correlation analysis. (D) LL1 gene expression volcano plot. (E) ZK1 gene expression volcano plot.
Figure 9
Figure 9
Gene expression clustering, principal components analysis (PCA), and correlation analysis. (A) Cluster analysis of gene expression. (B) Principle components analysis. (C) Correlation analysis. (D) LL1 gene expression volcano plot. (E) ZK1 gene expression volcano plot.
Figure 10
Figure 10
Bar plot for GO enrichment of DEGs. (A) GO enrichment bar plot of the LL1 DEGs. (B) GO enrichment bar plot of the ZK1 DEGs.
Figure 11
Figure 11
Bar plot for KEGG enrichment of DEGs. (A) KEGG enrichment plot of the LL1 DEGs. (B) KEGG enrichment plot of the ZK1 DEGs. Note: bar length represents the number of genes.
Figure 12
Figure 12
DEGs in the common KEGG pathway.
Figure 13
Figure 13
HMDB annotation results. (A) HMDB annotation results of LL1. (B) HMDB annotation results of ZK1.
Figure 14
Figure 14
DEMs KEGG enrichment analysis. (A) DEMs KEGG enrichment analysis of LL1. (B) DEMs KEGG enrichment analysis of ZK1.
Figure 15
Figure 15
Expressions of DEGs and DEMs in α-linolenic acid metabolism pathway. Heatmap using gene FPKM values and metabolite abundance. Note: Red triangles represent downregulated expression of DEGs and DEMs, green triangles represent up-regulated.

Similar articles

Cited by

References

    1. Brodribb T.J., Powers J., Cochard H., Choat B. Hanging by a thread? Forests and drought. Science. 2020;368:252–256. doi: 10.1126/science.aat7631. - DOI - PubMed
    1. Aslam M.U., Raza M.A.S., Saleem M.F., Waqas M., Iqbal R., Ahmad S., Haider I. Improving strategic growth stage-based drought tolerance in quinoa by rhizobacterial inoculation. Commun. Soil Sci. Plant Anal. 2020;51:853–868. doi: 10.1080/00103624.2020.1744634. - DOI
    1. Howell T.A. Enhancing water use efficiency in irrigated agriculture. Agron. J. 2001;93:281–289. doi: 10.2134/agronj2001.932281x. - DOI
    1. Vega-Gálvez A., Miranda M., Vergara J., Uribe E., Puente L., Martínez E.A. Nutrition facts and functional potential of quinoa (Chenopodium quinoa willd.), an ancient Andean grain: A review. J. Sci. Food Agric. 2010;90:2541–2547. doi: 10.1002/jsfa.4158. - DOI - PubMed
    1. Yasui Y., Hirakawa H., Oikawa T., Toyoshima M., Matsuzaki C., Ueno M., Mizuno N., Nagatoshi Y., Imamura T., Miyago M., et al. Draft genome sequence of an inbred line of Chenopodium quinoa, an allotetraploid crop with great environmental adaptability and outstanding nutritional properties. DNA Res. 2016;23:535–546. doi: 10.1093/dnares/dsw037. - DOI - PMC - PubMed

LinkOut - more resources