. 2024 Nov 15;25(22):12274.
doi: 10.3390/ijms252212274.

Chemical Landscape of Adipocytes Derived from 3T3-L1 Cells Investigated by Fourier Transform Infrared and Raman Spectroscopies

Affiliations

Chemical Landscape of Adipocytes Derived from 3T3-L1 Cells Investigated by Fourier Transform Infrared and Raman Spectroscopies

Karolina Augustyniak et al. Int J Mol Sci. .

Abstract

Adipocytes derived from 3T3-L1 cells are a gold standard for analyses of adipogenesis processes and the metabolism of fat cells. A widely used histological and immunohistochemical staining and mass spectrometry lipidomics are mainly aimed for examining lipid droplets (LDs). Visualizing other cellular compartments contributing to the cellular machinery requires additional cell culturing for multiple labeling. Here, we present the localization of the intracellular structure of the 3T3-L1-derived adipocytes utilizing vibrational spectromicroscopy, which simultaneously illustrates the cellular compartments and provides chemical composition without extensive sample preparation and in the naïve state. Both vibrational spectra (FTIR-Fourier transform infrared and RS-Raman scattering spectroscopy) extended the gathered chemical information. We proved that both IR and RS spectra provide distinct chemical information about lipid content and their structure. Despite the expected presence of triacylglycerols and cholesteryl esters in lipid droplets, we also estimated the length and unsaturation degree of the fatty acid acyl chains that were congruent with known MS lipidomics of these cells. In addition, the clustering of spectral images revealed that the direct surroundings around LDs attributed to lipid-associated proteins and a high abundance of mitochondria. Finally, by using quantified markers of biomolecules, we showed that the fixative agents, paraformaldehyde and glutaraldehyde, affected the cellular compartment differently. We concluded that PFA preserves LDs better, while GA fixation is better for cytochromes and unsaturated lipid analysis. The proposed analysis of the spectral images constitutes a complementary tool for investigations into the structural and molecular features of fat cells.

Keywords: FTIR and Raman spectroscopy imaging; adipocytes; cellular compartments; histochemical staining.


Conflict of interest statement

The authors declare no conflicts of interest.

Figures
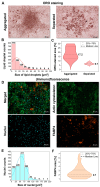
Figure 1
Figure 1
(A) Oil Red O (ORO) staining of aggregated (left) and separated (right) adipocytes derived from the 3T3-L1 cells with (B) LD size distribution (N = 10 images) and (C) a calculated stained area of both types of cells (N = 10 images). (D) Fluorescence images (N = 12 images) revealing the actin cytoskeleton (green), nuclei (blue), and immunolocalization of FABP4 protein (orange) of mature adipocytes with a calculated distribution of nuclei size (E) and area covered by FABP4 protein (F). The cells were fixed with 4% paraformaldehyde.
Figure 2
Figure 2
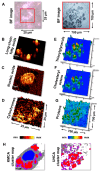
(A) Exemplary bright-field images of 3T3-L1-derived adipocytes obtained using Raman (left) and FTIR (right) microscopes. The high-resolution RS microscope enables the chemical imaging of the single cells (ca. 25 µm × 25 µm); whereas, FTIR microscopy depicts several adipocytes within an area of ca. 700 µm × 700 µm. Red squares illustrate the imaged regions. Obtained Raman (BD) and FTIR (EG) chemical images complementarily depict the distribution of primary components of adipocytes: (B) long-chain fatty acids (RS: 2853 cm−1), (C) nucleic acids (RS: 790 cm−1), (D) cytochromes (RS: 756 cm−1), (E) triacylglycerols (IR: 1744 cm−1), (F) cholesteryl esters (IR: 1169 cm−1), and (G) proteins (IR: 1651 cm−1). The maps were generated using the integral intensities of the marker IR and RS bands. (H) Through the similarity-based grouping of RS and IR spectra, the simplified cluster maps were obtained. The corresponding false-color KMCA (left) and UHCA maps (right) of RS and FTIR images, respectively, revealed the presence of the main subcellular compartments of adipocytes, i.e., lipid droplets (red), perilipidic area (purple), nucleus (blue), and cytoplasm (gray). The cells shown here were fixed with 4% PFA.
Figure 3
Figure 3
(A) The averaged Raman (N = 100) and (B) second derivative of FTIR spectra (N = 30) of the lipid droplets from PFA-fixed adipocytes in the spectral regions of 3050–550 cm−1 and 3070–1005 cm−1, respectively. (C) A calibration plot of the length of the FA acyl chains in saturated TAGs determined from the FTIR spectra of TCY—tricaprylin (24:0), TCI—tricaprin (30:0), TLU—trilaurin (36:0), TMA—trimyristin (42:0), TPA—tripalmitin (48:0), TSA—tristearin (54:0), TAR—triarachidin (60:0), and TBH—tribehenin (66:0) based on the ratio of the 2852 and 2954 cm−1 bands. A red square marks the ratio for the 3T3-L1 lipid droplets. (D) A calibration plot of the unsaturation degree of the FA acyl chain determined from the Raman spectra of SA—stearic acid (18:0), OA—oleic acid (18:1), LA—linoleic acid (18:2), and ALA—α-linolenic acid (18:3) based on the ratio of the 1660 and 1451 cm−1 bands. A red square marks the ratio for the 3T3-L1 lipid droplets.
Figure 4
Figure 4
(I). The scores values from principal component analysis performed on (A) RS and (B) FTIR spectra of lipid droplets, perilipidic area, and cytoplasm of 3T3-L1-derived adipocytes preserved with glutaraldehyde (GA, in blue) and paraformaldehyde (PFA, in green). (II). Box diagrams representing semiquantitative analysis of lipid classes and cytochromes identified in the Raman (N = 100/fixative agent) and FTIR spectra (N = 30/fixative agent). (A) triacylglycerols—TAGs (IR: 1743/1465 cm−1), (B) cholesterol esters—CEs (IR: 1178/1465 cm−1), (C) the total content of lipids (IR: 2852 + 2954/1465 cm−1), (D) phospholipids—PLs (RS: 1129/1451 cm−1), (E) unsaturated fatty acids—UFAs (RS: 1660/1451 cm−1), (F) the length of acyl chain of FAs (IR: 2852/2954 cm−1), and (G) cytochromes (RS: 1585 + 1316 + 750/1451 cm−1). Each point refers to a single spectrum.

References

    1. Guo Y., Cordes K.R., Farese R.V., Walther T.C. Lipid Droplets at a Glance. J. Cell Sci. 2009;122:749–752. doi: 10.1242/jcs.037630. - DOI - PMC - PubMed
    1. Fujimoto T., Parton R.G. Not Just Fat: The Structure and Function of the Lipid Droplet. Cold Spring Harb. Perspect. Biol. 2011;3:a004838. doi: 10.1101/cshperspect.a004838. - DOI - PMC - PubMed
    1. Liao P.C., Yang E.J., Borgman T., Boldogh I.R., Sing C.N., Swayne T.C., Pon L.A. Touch and Go: Membrane Contact Sites Between Lipid Droplets and Other Organelles. Front. Cell Dev. Biol. 2022;10:852021. doi: 10.3389/fcell.2022.852021. - DOI - PMC - PubMed
    1. Cruz A.L.S., Barreto E.d.A., Fazolini N.P.B., Viola J.P.B., Bozza P.T. Lipid Droplets: Platforms with Multiple Functions in Cancer Hallmarks. Cell Death Dis. 2020;11:105. doi: 10.1038/s41419-020-2297-3. - DOI - PMC - PubMed
    1. Sanjabi B., Dashty M., Özcan B., Akbarkhanzadeh V., Rahimi M., Vinciguerra M., Van Rooij F., Al-Lahham S., Sheedfar F., Van Kooten T.G., et al. Lipid Droplets Hypertrophy: A Crucial Determining Factor in Insulin Regulation by Adipocytes. Sci. Rep. 2015;5:4–6. doi: 10.1038/srep08816. - DOI - PMC - PubMed

LinkOut - more resources