. 2024 Nov 15;25(22):12267.
doi: 10.3390/ijms252212267.

Galangin Triggers Eryptosis and Hemolysis Through Ca2+ Nucleation and Metabolic Collapse Mediated by PKC/CK1α/COX/p38/Rac1 Signaling Axis

Affiliations

Galangin Triggers Eryptosis and Hemolysis Through Ca2+ Nucleation and Metabolic Collapse Mediated by PKC/CK1α/COX/p38/Rac1 Signaling Axis

Mohammad A Alfhili et al. Int J Mol Sci. .

Abstract

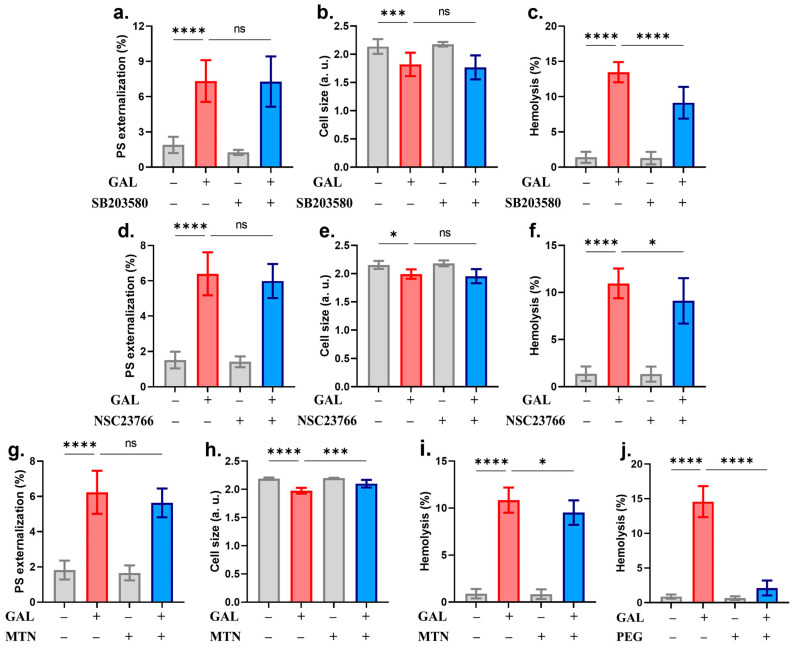
Anticancer drugs cause anemia in patients through eryptosis and hemolysis. We thus studied the in vitro toxicity of galangin (GAL) in red blood cells (RBCs). RBCs were exposed to 50-500 μM of GAL and analyzed for markers of eryptosis and hemolysis. Ca2+ nucleation, phosphatidylserine (PS) externalization, oxidative stress, and cell size were detected via fluorescence-activated cell sorting using Fluo4/AM, annexin-V-FITC, 2',7'-dichlorodihydrofluorescein diacetate, and forward scatter (FSC), respectively. Acetylcholinesterase (AChE) activity was measured via Ellman's assay and ultrastructural morphology was examined via scanning electron microscopy. Membrane rupture and extracellular hemoglobin, aspartate transaminase (AST), and lactate dehydrogenase (LDH) were assessed via colorimetric methods. Distinct experiments were carried out to identify protective agents and signaling pathways using small-molecule inhibitors. GAL triggered sucrose-sensitive hemolysis with AST and LDH leakage, increased annexin-V-FITC and Fluo4 fluorescence, and decreased FSC and AChE activity which was associated with the formation of granulated echinocytes. Ca2+ omission and energy replenishment with glucose, adenine, and guanosine blunted PS externalization and preserved cellular volume. Moreover, caffeine, Trolox, heparin, and uric acid had similar ameliorative effects. Hemolysis was abrogated via caffeine, Trolox, heparin, mannitol, lactate, melatonin, and PEG 8000. Notably, co-treatment of cells with GAL and staurosporin, D4476, or acetylsalicylic acid prevented PS externalization whereas only the presence of SB203580 and NSC23766 rescued the cells from GAL-induced hemolysis. Ca2+ nucleation and metabolic collapse mediated by PKC/CK1α/COX/p38/Rac1 drive GAL-induced eryptosis and hemolysis. These novel findings carry ramifications for the clinical prospects of GAL in anticancer therapy.

Keywords: anticancer; calcium; eryptosis; galangin; hemolysis.


Conflict of interest statement

The authors declare no conflicts of interest.

Figures

Figure 1
Figure 1
Experimental design. Prepared with BioRender.
Figure 2
Figure 2
Eryptotic and hemolytic activities of GAL. (a) Chemical structure of GAL. (b) Original histograms of annexin-V-FITC fluorescence. (c) Percentage of eryptotic cells. (d) Percentage of hemolytic cells. (e) AST activity. (f) LDH activity. (g) CK activity. (h) K+ levels. (i) Correlation between eryptosis and hemolysis. (j) Osmotic fragility curves. (k) AChE activity. (l) B12 levels. (m) ESR. Graphs show means ± SD. * (p < 0.05), ** (p < 0.01), *** (p < 0.001), and **** (p < 0.0001).
Figure 3
Figure 3
GAL causes loss of cellular volume and Ca2+ nucleation. (a) Original histograms of FSC signals. (b) Original histograms of Fluo4 fluorescence. (c) Percentage of cell shrinkage. (d) Percentage with increased Ca2+. (e) Original histograms of annexin-V-FITC with and without Ca2+. (f) Original histograms of FSC with and without Ca2+. (g) Percentage of eryptotic cells. (h) Percentage of cell shrinkage. (i) Percentage of hemolyzed cells. (j) Original histograms of annexin-V-FITC in 5 and 125 mM KCl. (k) Original histograms of FSC in 5 and 125 mM KCl. (l) Percentage of eryptotic cells. (m) Percentage of cell shrinkage. (n) Percentage of hemolyzed cells. Graphs show means ± SD. No significance is indicated by ns whereas * (p < 0.05), ** (p < 0.01), *** (p < 0.001), and **** (p < 0.0001).
Figure 4
Figure 4
Ultrastructural morphology of RBCs. GAL induces the formation of granulated echinocytes. Magnification: ×5000. Scale bar: 1 μm.
Figure 5
Figure 5
Energy replenishment reverses GAL-induced cytotoxicity. (a) Original annexin-V-FITC histograms in 5 and 50 mM glucose. (b) Original FSC histograms in 5 and 50 mM glucose. (c) Percentage of eryptotic cells. (d) Percentage of cell shrinkage. (e) Percentage of hemolyzed cells. (f) Original annexin-V-FITC histograms with and without lactate. (g) Original FSC histograms with and without lactate. (h) Percentage of eryptotic cells. (i) Percentage of cell shrinkage. (j) Percentage of hemolyzed cells. (k) Original annexin-V-FITC histograms with and without adenine. (l) Original FSC histograms with and without adenine. (m) Percentage of eryptotic cells. (n) Percentage of cell shrinkage. (o) Percentage of hemolyzed cells. (p) Original annexin-V-FITC histograms with and without guanosine. (q) Original FSC histograms with and without guanosine. (r) Percentage of eryptotic cells. (s) Percentage of cell shrinkage. (t) Percentage of hemolyzed cells. Graphs show means ± SD. No significance is indicated by ns whereas * (p < 0.05), *** (p < 0.001) and **** (p < 0.0001).
Figure 6
Figure 6
Antieryptotic and antihemolytic effects of Trolox, uric acid, and ASA. (a) Original annexin-V-FITC histograms with and without Trolox. (b) Original FSC histograms with and without Trolox. (c) Percentage of eryptotic cells. (d) Percentage of cell shrinkage. (e) Percentage of hemolyzed cells. (f) Original annexin-V-FITC histograms with and without uric acid. (g) Original FSC histograms with and without uric acid. (h) Percentage of eryptotic cells. (i) Percentage of cell shrinkage. (j) Percentage of hemolyzed cells. (k) Original annexin-V-FITC histograms with and without ASA. (l) Original FSC histograms with and without ASA. (m) Percentage of eryptotic cells. (n) Percentage of cell shrinkage. (o) Percentage of hemolyzed cells. Graphs show means ± SD. No significance is indicated by ns whereas ** (p < 0.01) and **** (p < 0.0001).
Figure 7
Figure 7
Ameliorative effects of caffeine and heparin. (a) Original annexin-V-FITC histograms with and without caffeine. (b) Original FSC histograms with and without caffeine. (c) Percentage of eryptotic cells. (d) Percentage of cell shrinkage. (e) Percentage of hemolyzed cells. (f) Original annexin-V-FITC histograms with and without heparin. (g) Original FSC histograms with and without heparin. (h) Percentage of eryptotic cells. (i) Percentage of cell shrinkage. (j) Percentage of hemolyzed cells. Graphs show means ± SD **** (p < 0.0001).
Figure 8
Figure 8
Inhibitors of GAL-induced eryptosis. (a) Original annexin-V-FITC histograms with and without staurosporin. (b) Original FSC histograms with and without staurosporin. (c) Percentage of eryptotic cells. (d) Percentage of cell shrinkage. (e) Percentage of hemolyzed cells. (f) Original annexin-V-FITC histograms with and without D4476. (g) Original FSC histograms with and without D4476. (h) Percentage of eryptotic cells. (i) Percentage of cell shrinkage. (j) Percentage of hemolyzed cells. Graphs show means ± SD. No significance is indicated by ns whereas * (p < 0.05), ** (p < 0.01), *** (p < 0.001), and **** (p < 0.0001).
Figure 9
Figure 9
Inhibitors of GAL-induced hemolysis. (a) Percentage of eryptotic cells, (b) shrinkage, and (c) hemolysis with and without SB203580. (d) Percentage of eryptotic cells, (e) shrinkage, and (f) hemolysis with and without NSC23766. (g) Percentage of eryptotic cells, (h) shrinkage, and (i) hemolysis with and without MTN. (j) Effect of GAL on hemolysis with and without PEG. Graphs show means ± SD. No significance is indicated by ns whereas * (p < 0.05), *** (p < 0.001), and **** (p < 0.0001).
Figure 10
Figure 10
Analysis of antioxidants and signaling pathways. Hemolytic rates in the presence and absence of (a) L-NAME, (b) vitamin C, (c) GSH, (d) Z-VAD-FMK, (e) myriocin, (f) BAPTA-AM, (g) necrostatin-2, (h) NSA, and (i) ATP. Graphs show means ± SD. No significance is indicated by ns whereas **** (p < 0.0001).
Figure 11
Figure 11
GAL toxicity under hyperosmotic stress. (a) Original annexin-V-FITC histograms with and without urea. (b) Original FSC histograms with and without urea. (c) Percentage of eryptotic cells. (d) Percentage of cell shrinkage. (e) Percentage of hemolyzed cells. (f) Original annexin-V-FITC histograms with and without mannitol. (g) Original FSC histograms with and without mannitol. (h) Percentage of eryptotic cells. (i) Percentage of cell shrinkage. (j) Percentage of hemolyzed cells. (k) Original annexin-V-FITC histograms with and without sucrose. (l) Original FSC histograms with and without sucrose. (m) Percentage of eryptotic cells. (n) Percentage of cell shrinkage. (o) Percentage of hemolyzed cells. Graphs show means ± SD. No significance is indicated by ns whereas * (p < 0.05), *** (p < 0.001), and **** (p < 0.0001).
Figure 12
Figure 12
A working model of GAL-induced RBC death. Prepared with BioRender.

Similar articles

Cited by

References

    1. Suvarna V., Gujar P., Murahari M. Complexation of phytochemicals with cyclodextrin derivatives—An insight. Biomed. Pharmacother. 2017;88:1122–1144. doi: 10.1016/j.biopha.2017.01.157. - DOI - PubMed
    1. Zhang H.T., Wu J., Wen M., Su L.J., Luo H. Galangin induces apoptosis in hepatocellular carcinoma cells through the caspase 8/t-Bid mitochondrial pathway. J. Asian Nat. Prod. Res. 2012;14:626–633. doi: 10.1080/10286020.2012.682152. - DOI - PubMed
    1. Zhang H.T., Luo H., Wu J., Lan L.B., Fan D.H., Zhu K.D., Chen X.Y., Wen M., Liu H.M. Galangin induces apoptosis of hepatocellular carcinoma cells via the mitochondrial pathway. World J. Gastroenterol. 2010;16:3377–3384. doi: 10.3748/wjg.v16.i27.3377. - DOI - PMC - PubMed
    1. Zhong X., Huang S., Liu D., Jiang Z., Jin Q., Li C., Da L., Yao Q., Wang D. Galangin promotes cell apoptosis through suppression of H19 expression in hepatocellular carcinoma cells. Cancer Med. 2020;9:5546–5557. doi: 10.1002/cam4.3195. - DOI - PMC - PubMed
    1. Kim D.A., Jeon Y.K., Nam M.J. Galangin induces apoptosis in gastric cancer cells via regulation of ubiquitin carboxy-terminal hydrolase isozyme L1 and glutathione S-transferase P. Food Chem. Toxicol. 2012;50:684–688. doi: 10.1016/j.fct.2011.11.039. - DOI - PubMed

LinkOut - more resources