. 2024 Nov 19;25(22):12416.
doi: 10.3390/ijms252212416.

Resistance Exercise Improves Glycolipid Metabolism and Mitochondrial Biogenesis in Skeletal Muscle of T2DM Mice via miR-30d-5p/SIRT1/PGC-1α Axis

Affiliations

Resistance Exercise Improves Glycolipid Metabolism and Mitochondrial Biogenesis in Skeletal Muscle of T2DM Mice via miR-30d-5p/SIRT1/PGC-1α Axis

Lifang Zheng et al. Int J Mol Sci. .

Abstract

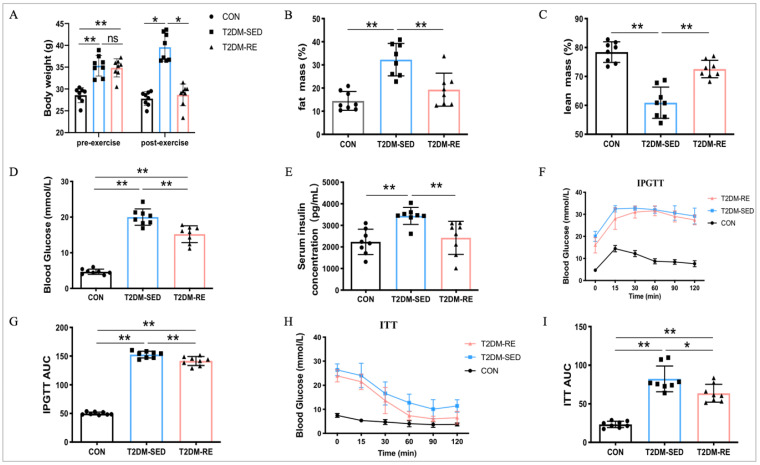
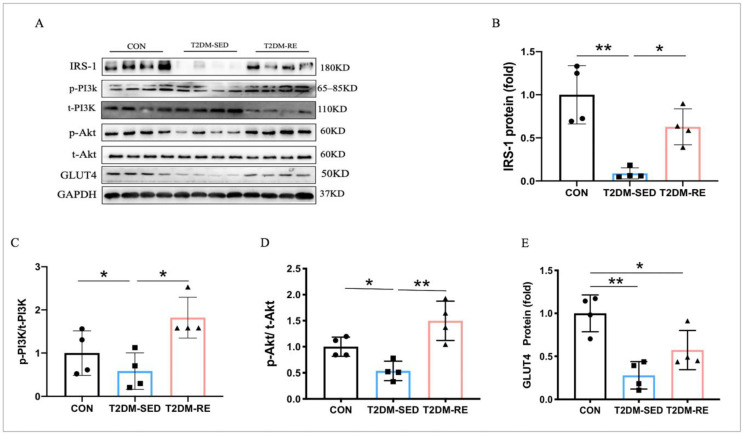
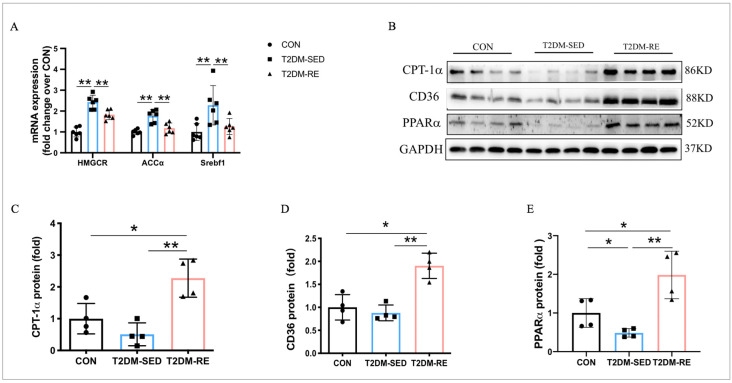
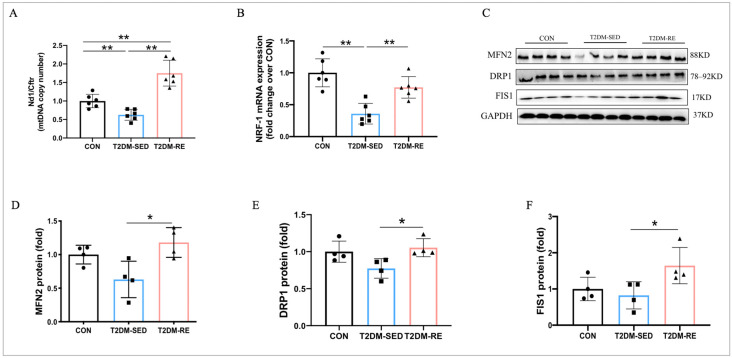
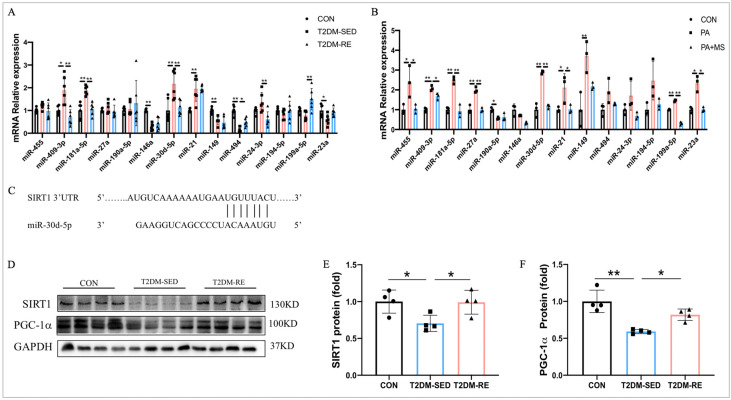
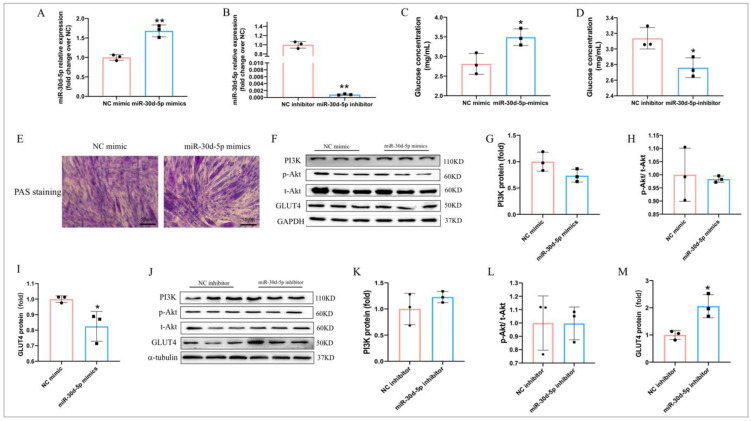
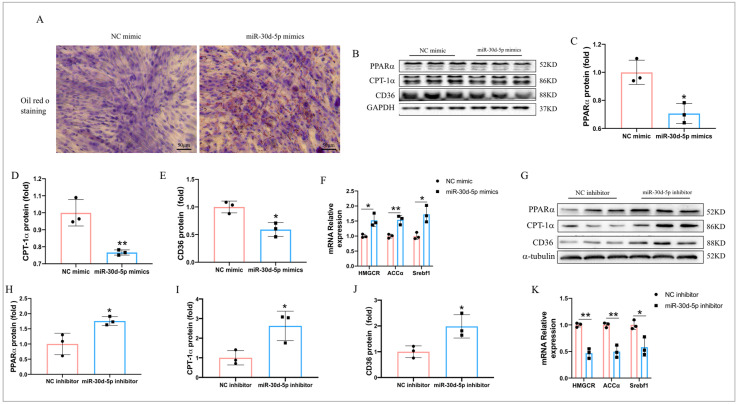
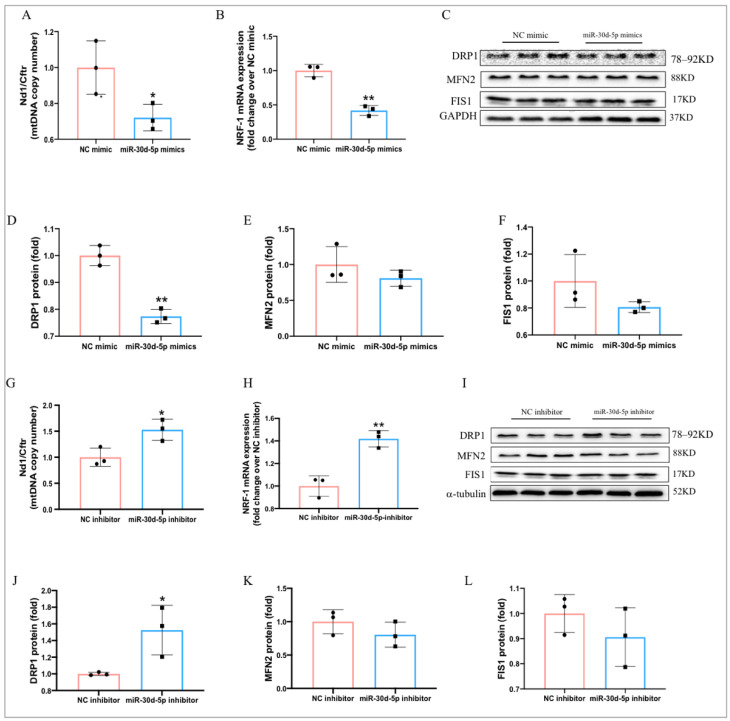
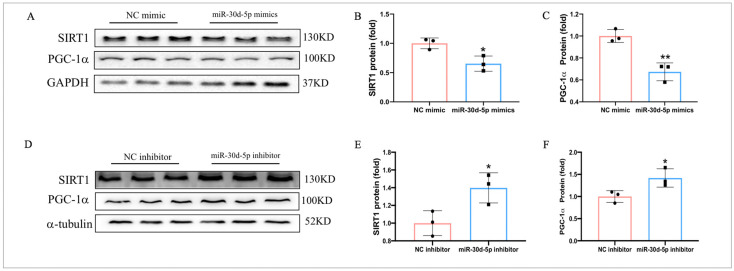
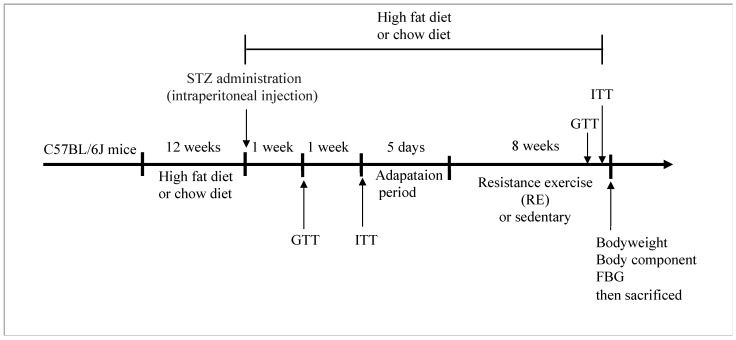
Exercise is a recognized non-pharmacological treatment for improving glucose homeostasis in type 2 diabetes (T2DM), with resistance exercise (RE) showing promising results. However, the mechanism of RE improving T2DM has not been clarified. This study aims to investigate the effects of RE on glucose and lipid metabolism, insulin signaling, and mitochondrial function in T2DM mice, with a focus on the regulatory role of miR-30d-5p. Our results confirmed that RE significantly improved fasting blood glucose, IPGTT, and ITT in T2DM mice. Enhanced expression of IRS-1, p-PI3K, and p-Akt indicated improved insulin signaling. RE improved glycolipid metabolism, as well as mitochondrial biogenesis and dynamics in skeletal muscle of T2DM mice. We also found that miR-30d-5p was upregulated in T2DM, and was downregulated after RE. Additionally, in vitro, over-expression of miR-30d-5p significantly increased lipid deposition, and reduced glucose uptake and mitochondrial biogenesis. These observations were reversed after transfection with the miR-30d-5p inhibitor. Mechanistically, miR-30d-5p regulates glycolipid metabolism in skeletal muscle by directly targeting SIRT1, which affects the expression of PGC-1α, thereby influencing mitochondrial function and glycolipid metabolism. Taken together, RE effectively improves glucose and lipid metabolism and mitochondrial function in T2DM mice, partly through regulating the miR-30d-5p/SIRT1/PGC-1α axis. miR-30d-5p could serve as a potential therapeutic target for T2DM management.

Keywords: T2DM; insulin resistance; miRNAs; resistance exercise; skeletal muscle.


Conflict of interest statement

The authors declare no competing interests.

Figures

Figure 1
Figure 1
Resistance exercise improved body composition and glucose handling in T2DM mice. (A) Body weight; (B) fat mass (%); (C) lean mass (%); (D) fasting blood glucose; (E) serum insulin concentration; (F) plot for glucose tolerance tests (IPGTT, 1g/kg BW) in overnight fasted mice; (G) AUC values confirmed impairment of glucose tolerance in T2DM mice; (H) plots for insulin tolerance tests (ITT, 1IU/kg BW) in mice fasted for 6h; (I) AUC values confirmed impairment of insulin tolerance in T2DM mice. All data are presented as mean ± SD. n = 8 per group; * p < 0.05, ** p < 0.01.
Figure 2
Figure 2
RE improved insulin sensitivity and glucose metabolism in the skeletal muscle of T2DM mice. (A) Western blot results revealed protein levels of IRS-1, p-PI3K/t-PI3K, p-Akt/t-Akt, and GLUT4 in skeletal muscle; (BE) quantification of IRS-1, p-PI3K/t-PI3K, p-Akt/t-Akt, and GLUT4 expression levels presented in (A). All data are presented as mean ± SD. n = 3 per group; * p < 0.05, ** p < 0.01.
Figure 3
Figure 3
RE promoted lipid oxidation and transport and inhibited lipid synthesis in skeletal muscle of T2DM mice. (A) Relative mRNA expression of HMGCR, ACCα, and Srebf1 measured by qRT-PCR; (B) Western blot results revealed protein levels of CPT-1α, CD36, PPARα in skeletal muscle; (CE) quantification of CPT-1α, CD36, and PPARα expression levels presented in (A). All data are presented as mean ± SD. n = 4 per group; * p < 0.05, ** p < 0.01.
Figure 4
Figure 4
RE enhanced mitochondrial biogenesis and dynamics in the skeletal muscle of T2DM mice. (A) Mitochondrial DNA copy number; (B) relative mRNA expression of NRF-1 measured by qRT-PCR; (C) Western blot results revealed protein levels of MFN2, DRP1, and FIS1 in skeletal muscle; (DF) quantification of MFN2, DRP1, and FIS1 expression levels presented in (C). All data are presented as mean ± SD. n = 4 per group; * p < 0.05, ** p < 0.01.
Figure 5
Figure 5
RE regulates the miR-30d-5p/SIRT1/PGC-1α axis. (A,B) Relative mRNA expressions of miR-455, miR-409-3p, miR-181a-5p, miR-27a, miR-190a-5p, miR-146a, miR-30d-5p, miR-21, miR-149, miR-494, miR-24-3p, miR-194-5p, miR-199a-5p, and miR-23a in C2C12 myotube cells/skeletal muscle; (C) TargetScan predicts target genes for miR-30d-5p; (D) Western blot results revealed protein levels of SIRT1 and PGC-1α in skeletal muscle; (E,F) quantification of SIRT1 and PGC-1α expression levels presented in (D). All data are presented as mean ± SD. n = 4 per group; * p < 0.05, ** p < 0.01.
Figure 6
Figure 6
miR-30d-5p regulates glucose metabolism in C2C12 myotube cells. (A,B) miR-30d-5p relative expression after transfection with miR-30d-5p mimics/inhibitor; (C,D) glucose concentration after transfection with miR-30d-5p mimics/inhibitor; (E) PAS staining in C2C12 myotube cells after transfection with miR-30d-5p mimics; (F) Western blot results revealed protein levels of PI3K, p-Akt, t-Akt, and GLUT4 after transfection with miR-30d-5p mimics; (GI) quantification of PI3K, p-Akt, t-Akt, and GLUT4 expression levels presented in (F); (J) Western blot results revealed protein levels of PI3K, p-Akt, t-Akt, and GLUT4 after transfection with miR-30d-5p inhibitor; (K–M) quantification of PI3K, p-Akt, t-Akt, and GLUT4 expression levels presented in (J). All data are presented as mean ± SD. n = 3 per group; Scale bars, 50 μm, * p < 0.05, ** p < 0.01.
Figure 7
Figure 7
miR-30d-5p regulates lipid metabolism in C2C12 myotube cells. (A) Oil Red O staining in C2C12 myotube cells after transfection with miR-30d-5p mimics; (B) Western blot results revealed protein levels of PPARα, CPT-1α, and CD36 after transfection with miR-30d-5p mimics; (CE) quantification of PPARα, CPT-1α, and CD36 expression levels presented in (B); (F) relative mRNA expression of HMGCR, ACCα, and Srebf1 after transfection with miR-30d-5p mimics; (G) Western blot results revealed protein levels of PPARα, CPT-1α, and CD36 after transfection with miR-30d-5p inhibitor. (HJ) quantification of PPARα, CPT-1α, and CD36 expression levels presented in (G); (K) relative mRNA expression of HMGCR, ACCα, and Srebf1 after transfection with miR-30d-5p inhibitor. All data are presented as mean ± SD. n = 3 per group; Scale bars, 50 μm, * p < 0.05, ** p < 0.01.
Figure 8
Figure 8
miR-30d-5p regulates mitochondrial biogenesis and dynamics in C2C12 myotube cells. (A) mtDNA copy number after transfection with miR-30d-5p mimics; (B) relative mRNA expression of NRF-1 after transfection with miR-30d-5p mimics; (C) Western blot results revealed protein levels of DRP1, MFN2, and FIS1 after transfection with miR-30d-5p mimics; (DF) quantification of DRP1, MFN2, and FIS1 expression levels presented in (C); (G) mtDNA copy number after transfection with miR-30d-5p inhibitor; (H) relative mRNA expression of NRF-1 after transfection with miR-30d-5p inhibitor; (I) Western blot results revealed protein levels of DRP1, MFN2, and FIS1 after transfection with miR-30d-5p inhibitor; (JL) quantification of DRP1, MFN2, and FIS1 expression levels presented in (I). All data are presented as mean ± SD. n = 3 per group; * p < 0.05, ** p < 0.01.
Figure 9
Figure 9
MiR-30d-5p targets SIRT1 and regulates the expression of PGC-1α. (A) Western blot results revealed protein levels of SIRT1and PGC-1α after transfection with miR-30d-5p mimics; (B) Western blot results revealed protein levels of SIRT1and PGC-1α after transfection with miR-30d-5p inhibitor; (C,D) quantification of SIRT1and PGC-1α expression levels presented in (A); (E,F) quantification of SIRT1and PGC-1α expression levels presented in (B). All data are presented as mean ± SD. n = 3 per group; * p < 0.05, ** p < 0.01.
Figure 10
Figure 10
Schematic diagram of the experiment: 12 weeks of high-fat feeding was combined with intraperitoneal injection of STZ to induce a type 2 diabetes model. One or two weeks later, glucose tolerance and insulin tolerance tests were measured. Then, T2DM mice were treated with or without RE for 8 weeks.

Similar articles

Cited by

References

    1. IDF Diabetes Atlas. [(accessed on 1 October 2024)]. Available online: https://diabetesatlas.org/atlas/ninth-edition/
    1. Sun Y., Tao Q., Wu X., Zhang L., Liu Q., Wang L. The Utility of Exosomes in Diagnosis and Therapy of Diabetes Mellitus and Associated Complications. Front. Endocrinol. 2021;12 doi: 10.3389/fendo.2021.756581. - DOI - PMC - PubMed
    1. Buresh R., Berg K. Exercise for the management of type 2 diabetes mellitus: Factors to consider with current guidelines. J. Sports Med. Phys. Fit. 2018;58:510–524. doi: 10.23736/S0022-4707.17.06969-9. - DOI - PubMed
    1. Bucci M., Huovinen V., Guzzardi M.A., Koskinen S., Raiko J.R., Lipponen H., Ahsan S., Badeau R.M., Honka M.-J., Koffert J., et al. Resistance training improves skeletal muscle insulin sensitivity in elderly offspring of overweight and obese mothers. Diabetologia. 2015;59:77–86. doi: 10.1007/s00125-015-3780-8. - DOI - PubMed
    1. Kim J.-Y., Choi M.J., So B., Kim H.-J., Seong J.K., Song W. The Preventive Effects of 8 Weeks of Resistance Training on Glucose Tolerance and Muscle Fiber Type Composition in Zucker Rats. Diabetes Metab. J. 2015;39:424–433. doi: 10.4093/dmj.2015.39.5.424. - DOI - PMC - PubMed

MeSH terms

LinkOut - more resources