. 2024 Oct 25;12(11):2146.
doi: 10.3390/microorganisms12112146.

Differential Host Gene Expression in Response to Infection by Different Mycobacterium tuberculosis Strains-A Pilot Study

Affiliations

Differential Host Gene Expression in Response to Infection by Different Mycobacterium tuberculosis Strains-A Pilot Study

Dewi Megawati et al. Microorganisms. .

Abstract

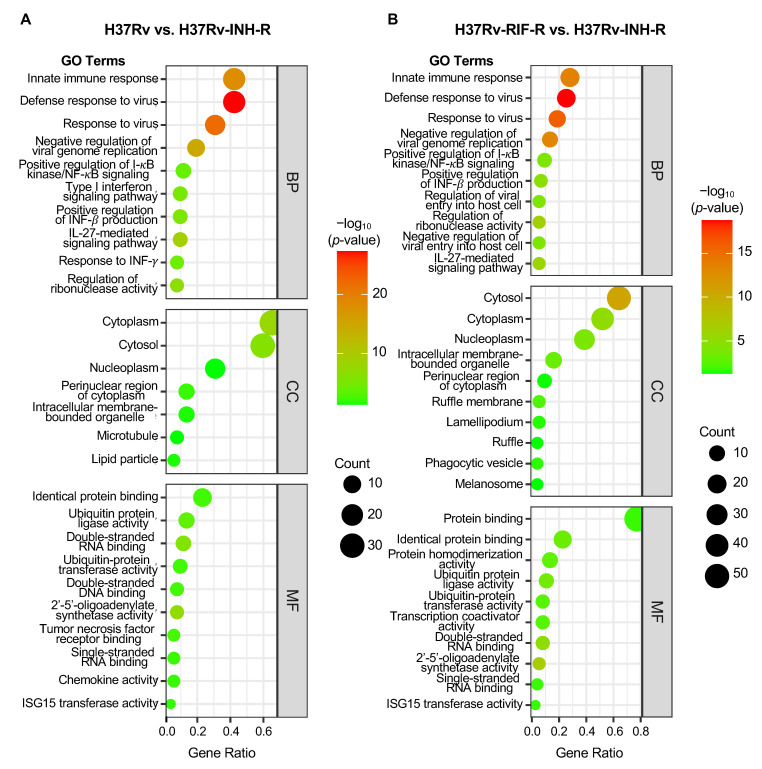
Tuberculosis (TB) represents a global public health threat and is a leading cause of morbidity and mortality worldwide. Effective control of TB is complicated with the emergence of multidrug resistance. Yet, there is a fundamental gap in understanding the complex and dynamic interactions between different Mycobacterium tuberculosis strains and the host. In this pilot study, we investigated the host immune response to different M. tuberculosis strains, including drug-sensitive avirulent or virulent, and rifampin-resistant or isoniazid-resistant virulent strains in human THP-1 cells. We identified major differences in the gene expression profiles in response to infection with these strains. The expression of IDO1 and IL-1β in the infected cells was stronger in all virulent M. tuberculosis strains. The most striking result was the overexpression of many interferon-stimulated genes (ISGs) in cells infected with the isoniazid-resistant strain, compared to the rifampin-resistant and the drug-sensitive strains. Our data indicate that infection with the isoniazid-resistant M. tuberculosis strain preferentially resulted in cGAS-STING/STAT1 activation, which induced a characteristic host immune response. These findings reveal complex gene signatures and a dynamic variation in the immune response to infection by different M. tuberculosis strains.

Keywords: Mycobacterium tuberculosis; antimicrobial resistance; expression profiling genes; host–pathogen interaction; interferon-stimulated genes (ISGs).


Conflict of interest statement

The authors declare no conflict of interest. The funders had no role in the design of the study; in the collection, analyses, or interpretation of data; in the writing of the manuscript; or in the decision to publish the results.

Figures

Figure 1
Figure 1
Multidimensional scaling (MDS) plot based on the expression of all microarray genes between M. tuberculosis-infected and mock-infected THP-1 cells at two time points of infection. Circles represent data based on 4 h post-infection, and triangles depict data based on 24 h post-infection. Each specifically colored circle or triangle represents a replicate of each sample.
Figure 2
Figure 2
Number of differentially expressed genes (DEGs) in THP-1 cells at 4 h and 24 h post-infection (p < 0.05). (A) M. tuberculosis-infected cells relative to mock-infected cells. (B) Pairwise comparisons of M. tuberculosis-infected cells.
Figure 3
Figure 3
Venn diagrams of DEGs in THP-1 cells at 24 h post-infection (p < 0.05). The overlapping genes represent the overall number of DEGs between the different comparison groups, while the non-overlapping numbers designate the unique genes to each group. (A) Pairwise comparisons between M. tuberculosis-infected and mock-infected cells. (B) Pairwise comparisons between M. tuberculosis-infected cells.
Figure 4
Figure 4
Fold change in the expression of DEGs in THP-1 cell lines infected with reference M. tuberculosis strains relative to mock-infected cells (24 h post-infection; p < 0.05). Representatives of different degrees of variation in gene expression are depicted in this figure. (A) Relative fold changes in gene expression above 10 are shown. (B) Relative fold changes in gene expression between 5 and 10 are shown. (C) Relative fold changes in gene expression between 1 and 5 are shown.
Figure 5
Figure 5
Volcano plots displaying differentially expressed genes in THP-1 cells in three different comparison groups (24 h post-infection; p < 0.05). The 20 most highly significant DEGs in each plot are indicated in the insets. These genes all indicate higher expression in H37Rv-INH-R-infected cells, relative to H37Rv- and H37Rv-RIF-R-infected cells. (A) H37Rv vs. H37Rv-INH-R. (B) H37Rv-RIF-R vs. H37Rv-INH-R. (C) H37Rv-INH-R vs. H37Ra.
Figure 6
Figure 6
Heatmap and clustering across M. tuberculosis-infected THP-1 cells relative to mock-infected cells at 4 h and 24 h post-infection, using the top 100 most significant DEGs in cells infected with isoniazid-resistant H37Rv strain at 24 h post-infection. Samples with a relatively high expression of a given gene are shown in red, and samples with a relatively low expression are shown in blue. Lighter color shades and white indicate genes with intermediate expression levels. Some of the interferon-stimulated genes (ISGs) are marked in green, and their overexpression in cells infected with the isoniazid-resistant H37Rv strain is indicated with a green box in the plot.
Figure 7
Figure 7
Bubble plot of GO enrichment analysis of up-regulated DEGs in cells infected with the isoniazid-resistant H37Rv strain (24 h post-infection; p < 0.05). All GO terms are grouped into three categories: biological process (BP), cellular component (CC), and molecular function (MF). (A) Comparison group: drug-sensitive H37Rv vs. isoniazid-resistant H37Rv. (B) Comparison group: rifampin-resistant H37Rv vs. isoniazid-resistant H37Rv.
Figure 8
Figure 8
KEGG analysis of up-regulated DEGs in cells infected with the isoniazid-resistant H37Rv strain. The first ten enriched pathways at 24 h post-infection are shown (p < 0.05). The KEGG pathways were subsequently divided into three or four categories: environmental information processing, organismal systems, genetic information processing and human diseases. (A) Comparison group drug-sensitive H37Rv vs. isoniazid-resistant H37Rv. (B) Comparison group rifampin-resistant H37Rv vs. isoniazid-resistant H37Rv.
Figure 9
Figure 9
Model for host signaling response to reference M. tuberculosis strains. Different font size is used to illustrate the changes in host response to the different reference M. tuberculosis strains. Higher gene expression is shown in a big font size, and lower gene expression is shown in small font size. H37Rv-INH-R induced the highest expression of ISGs and PKR compared to the other strains, as indicated by the circles and the big font size.

References

    1. World Health Organization (WHO) Global Tuberculosis Report 2022. [(accessed on 22 June 2023)]. Available online: https://www.who.int/teams/global-tuberculosis-programme/tb-reports/globa....
    1. Chakaya J., Petersen E., Nantanda R., Mungai B.N., Migliori G.B., Amanullah F., Lungu P., Ntoumi F., Kumarasamy N., Maeurer M., et al. The WHO global tuberculosis 2021 report—Not so good news and turning the tide back to end TB. Int. J. Infect. Dis. 2022;124:S26–S29. doi: 10.1016/j.ijid.2022.03.011. - DOI - PMC - PubMed
    1. Velayati A.A., Farnia P., Masjedi M.R. The totally drug resistant tuberculosis (TDR-TB) Int. J. Clin. Exp. Med. 2013;6:307–309. - PMC - PubMed
    1. Klopper M., Warren R.M., Hayes C., van Pittius N.C.G., Streicher E.M., Müller B., Sirgel F.A., Chabula-Nxiweni M., Hoosain E., Coetzee G., et al. Emergence and spread of extensively and totally drug-resistant tuberculosis, South Africa. Emerg. Infect. Dis. 2013;19:449–455. doi: 10.3201/eid1903.120246. - DOI - PMC - PubMed
    1. Zhan L., Wang J., Wang L., Qin C. The correlation of drug resistance and virulence in Mycobacterium tuberculosis. Biosaf. Health. 2020;2:18–24. doi: 10.1016/j.bsheal.2020.02.004. - DOI