. 2024 Nov 9;17(11):1508.
doi: 10.3390/ph17111508.

Identification of Estrogen-Responsive Proteins in Mouse Seminal Vesicles Through Mass Spectrometry-Based Proteomics

Affiliations

Identification of Estrogen-Responsive Proteins in Mouse Seminal Vesicles Through Mass Spectrometry-Based Proteomics

Ammar Kapic et al. Pharmaceuticals (Basel). .

Abstract

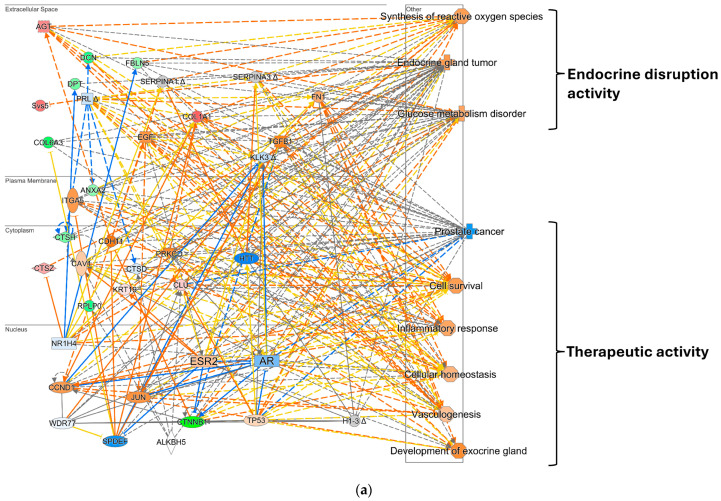
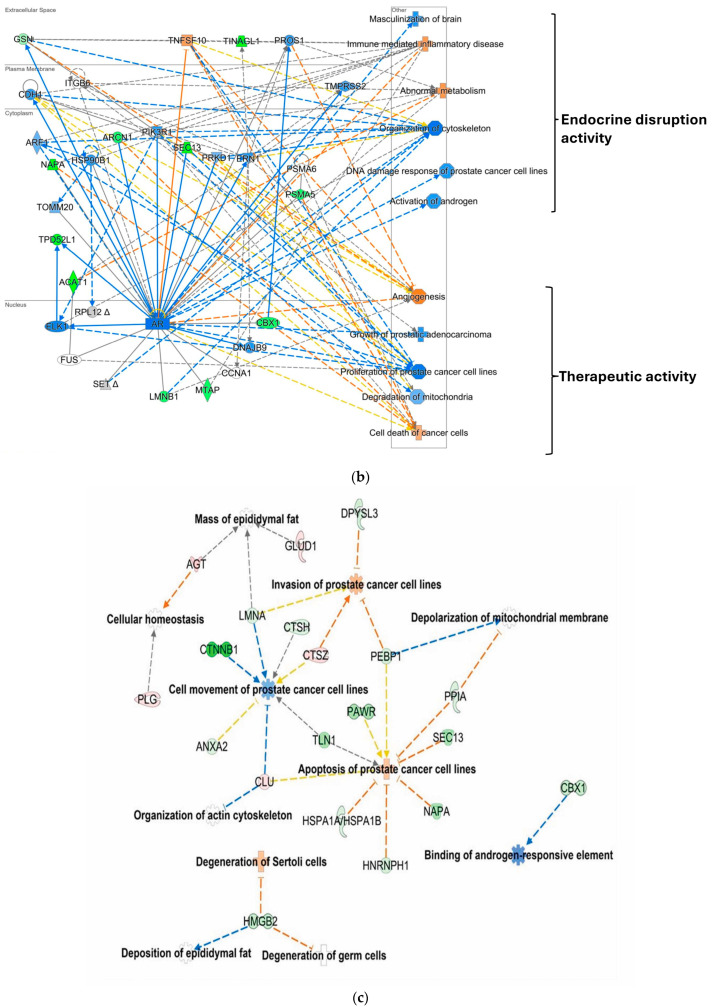
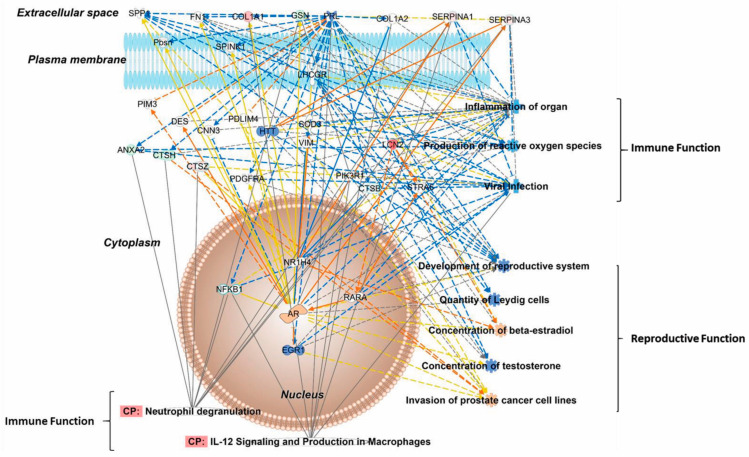
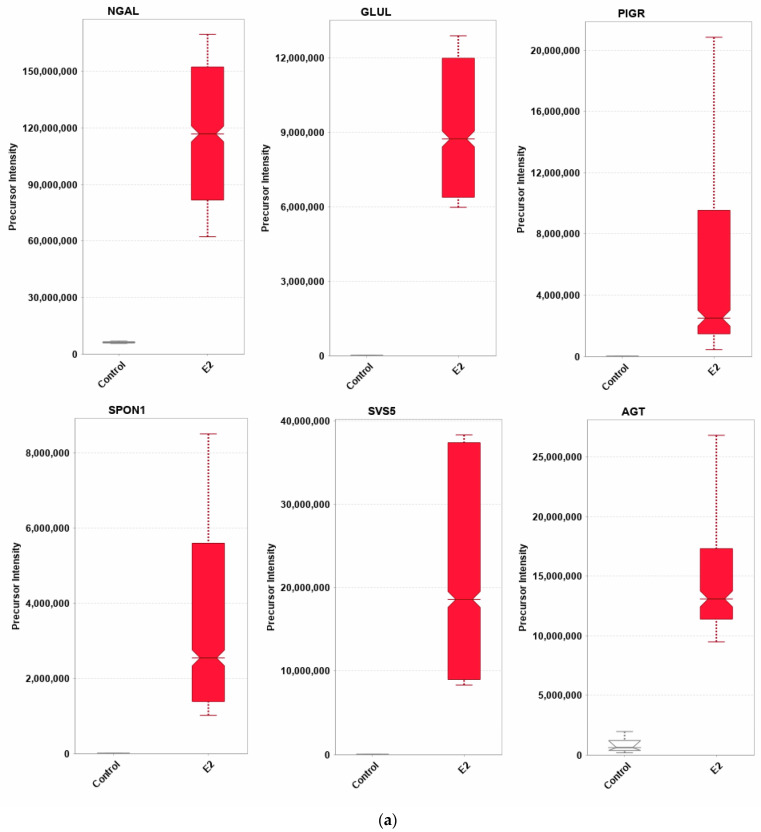
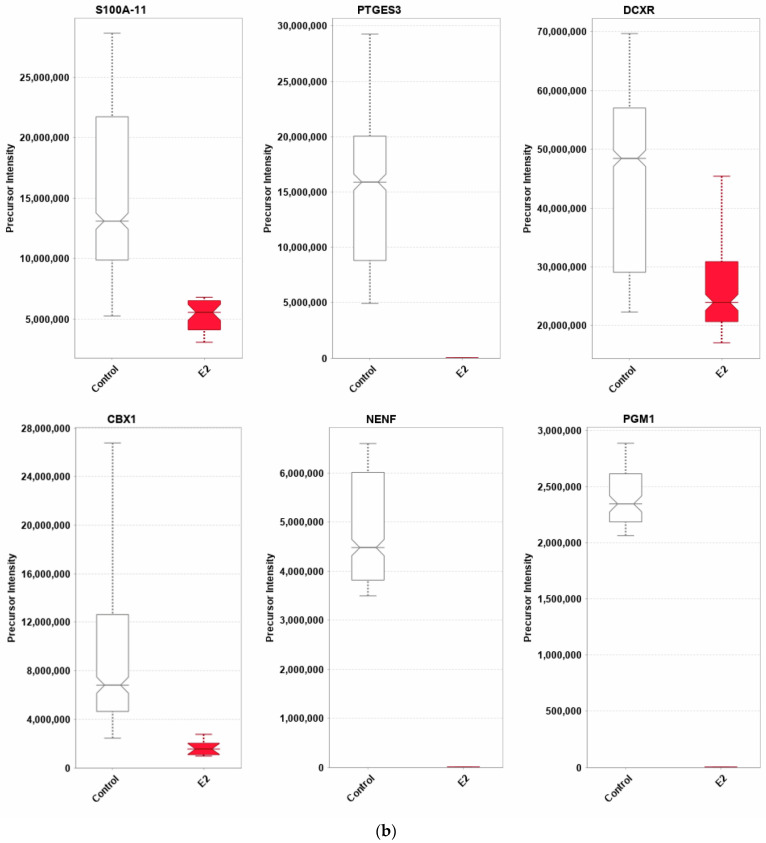
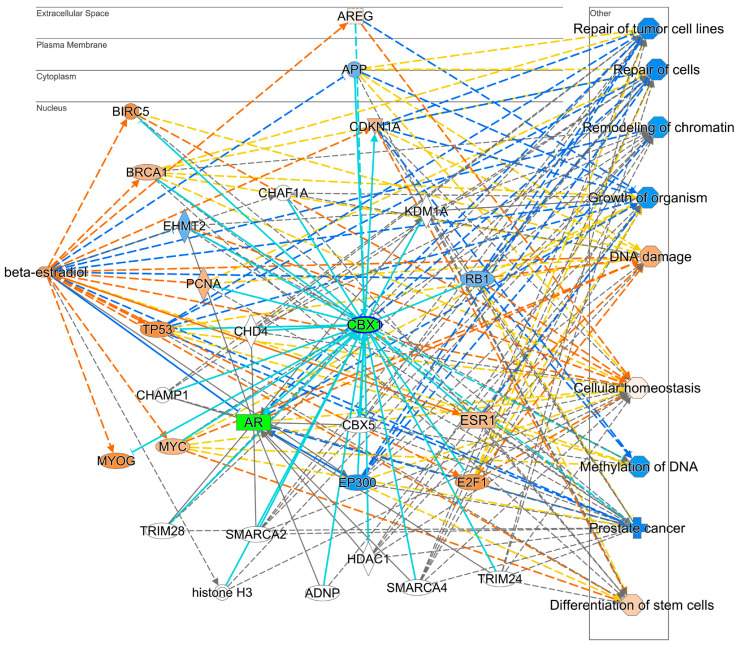
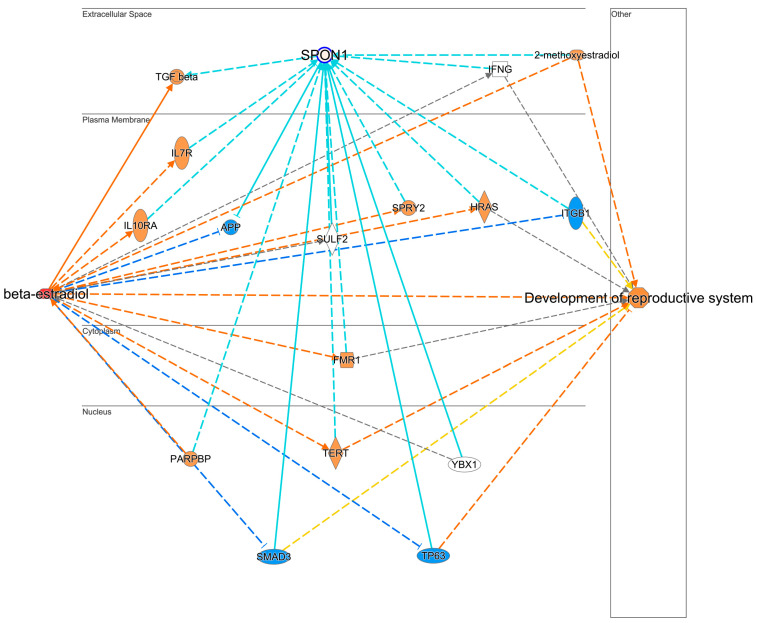
Background: Although estrogenic compounds promise therapeutic potential in treating various conditions, concerns regarding their endocrine-disrupting effects have been raised. Current methodologies for screening estrogenicity in rodent models are limited to the female-specific uterotrophic bioassay. Studies have reported enlargement of the seminal vesicles in orchiectomized males treated with estrogens. However, identifying estrogenicity strictly through changes in wet weights is uninformative regarding the molecular mechanisms of these agents. Therefore, protein-based biomarkers can complement and improve the sensitivity of weight-based assessments. To this end, we present a discovery-driven proteomic analysis of 17β-estradiol's effects on the seminal vesicles. Methods: We treated orchidectomized mice with the hormone for five days and used the vehicle-treated group as a control. Seminal vesicles were analyzed by shotgun approach using data-dependent nanoflow liquid chromatography-tandem mass spectrometry and label-free quantification. Proteins found to be differentially expressed between the two groups were processed through a bioinformatics pipeline focusing on pathway analyses and assembly of protein interaction networks. Results: Out of 668 identified proteins that passed rigorous validation criteria, 133 were regulated significantly by 17β-estradiol. Ingenuity Pathway Analysis® linked them to several hormone-affected pathways, including those associated with immune function such as neutrophil degranulation. The altered protein interaction networks were also related to functions including endocrine disruption, abnormal metabolism, and therapeutic effects. Conclusions: We identified several potential biomarkers for estrogenicity in mouse seminal vesicles, many of them not previously linked with exogenous 17β-estradiol exposure.

Keywords: 17β-estradiol; bioinformatics; biomarker discovery; endocrine disruption; male reproductive system; mouse seminal vesicle; proteomics; therapeutic effects.


Conflict of interest statement

The authors declare no conflicts of interest.

Figures

Figure 1
Figure 1
IPA®-generated protein interaction networks. (a) The top network representing cellular development, growth, proliferation, and movement. (b) Another network representing cell death and survival, cellular development, cellular growth, proliferation, and mapping AR-associated protein interactions. (c) The disease and function network, depicting specific proteins and their relationship with the development of reproductive growth and disease. Red and green colors depict quantified DEPs with increased or decreased measurements, respectively. Blue and orange depict predicted activation or suppression of the process using the MAP tool, respectively. Yellow lines indicate that the finding is inconsistent with the state of the downstream molecule. The intensity of the colors represents fold change or the Z score for the prediction. Solid and dashed lines represent direct and indirect interactions, respectively.
Figure 1
Figure 1
IPA®-generated protein interaction networks. (a) The top network representing cellular development, growth, proliferation, and movement. (b) Another network representing cell death and survival, cellular development, cellular growth, proliferation, and mapping AR-associated protein interactions. (c) The disease and function network, depicting specific proteins and their relationship with the development of reproductive growth and disease. Red and green colors depict quantified DEPs with increased or decreased measurements, respectively. Blue and orange depict predicted activation or suppression of the process using the MAP tool, respectively. Yellow lines indicate that the finding is inconsistent with the state of the downstream molecule. The intensity of the colors represents fold change or the Z score for the prediction. Solid and dashed lines represent direct and indirect interactions, respectively.
Figure 2
Figure 2
Network constructed with subset of proteins associated with neutrophil function. Blue and orange colors represent proteins’ predicted activation and suppression, respectively, for the MAP tool by IPA®. Red and green colors denote proteins with measured increases and decreases, respectively. Yellow dashed or solid lines indicate inconsistent findings with the downstream molecule. The intensity of the colors represents fold change or the Z score for the prediction. Solid and dashed lines represent direct and indirect interactions, respectively.
Figure 3
Figure 3
Fold changes of the 12 chosen representative SV proteins significantly affected by E2 treatment. (a) The panel significantly upregulated proteins in response to E2 treatment, namely neutrophil gelatinase-associated lipocalin (NGAL), glutamine synthase (GLUL), polymeric immunoglobulin receptor (PIGR), spondin-1 (SPON1), seminal vesicle secretory protein (SVS5), and angiotensinogen (AGT). (b) Significantly downregulated proteins in response to E2 treatment: protein S100A11, prostaglandin-synthase 3 (PTGES3), L-xylulose reductase (DCXR), chromobox 1 (CBX1), neudisin-1 (NENF), and phosphoglucomutase-1 (PGM1). Fold changes were calculated by Scaffold from tryptic peptide precursor intensities. All proteins in the figure were significantly dysregulated (p < 0.05) by E2 treatment; p values can be found in Table 4.
Figure 3
Figure 3
Fold changes of the 12 chosen representative SV proteins significantly affected by E2 treatment. (a) The panel significantly upregulated proteins in response to E2 treatment, namely neutrophil gelatinase-associated lipocalin (NGAL), glutamine synthase (GLUL), polymeric immunoglobulin receptor (PIGR), spondin-1 (SPON1), seminal vesicle secretory protein (SVS5), and angiotensinogen (AGT). (b) Significantly downregulated proteins in response to E2 treatment: protein S100A11, prostaglandin-synthase 3 (PTGES3), L-xylulose reductase (DCXR), chromobox 1 (CBX1), neudisin-1 (NENF), and phosphoglucomutase-1 (PGM1). Fold changes were calculated by Scaffold from tryptic peptide precursor intensities. All proteins in the figure were significantly dysregulated (p < 0.05) by E2 treatment; p values can be found in Table 4.
Figure 4
Figure 4
Protein interaction network and impacted biological functions generated by the hypothesis-generating pathway explorer tool depicting SPON-1 interaction with E2. No direct interaction between the ER and SPON-1 was found by IPA®. Blue and orange colors represent proteins’ predicted activation and suppression by the MAP tool of IPA®, respectively. Red and green colors denote proteins which were found to increase and decrease, respectively. Teal solid and dashed lines indicate the closest relationship pattern of SPON1 with other proteins. The intensity of the colors represents fold change or the Z score for the prediction. Solid and dashed lines represent direct and indirect interactions.
Figure 5
Figure 5
Protein interaction network and impacted biological functions generated by the hypothesis-generating pathway explorer tool. The network represents interaction between E2 and CBX1. Blue and orange colors represent proteins’ predicted activation and suppression by the MAP tool of IPA, respectively. Red and green colors denote proteins which were found to increase and decrease, respectively. Teal solid and dashed lines indicate the closest relationship pattern of CBX1 with other proteins. The intensity of the colors represents fold change or the Z score for the prediction. Solid and dashed lines represent direct and indirect interactions, respectively.

Similar articles

References

    1. Conde D.M., Verdade R.C., Valadares A.L.R., Mella L.F.B., Pedro A.O., Costa-Paiva L. Menopause and cognitive impairment: A narrative review of current knowledge. World J. Psychiatry. 2021;11:412–428. doi: 10.5498/wjp.v11.i8.412. - DOI - PMC - PubMed
    1. Chakraborty B., Byemerwa J., Krebs T., Lim F., Chang C.-Y., McDonnell D.P. Estrogen receptor signaling in the immune system. Endocr. Rev. 2023;44:117–141. doi: 10.1210/endrev/bnac017. - DOI - PubMed
    1. Khosla S., Oursler M.J., Monroe D.G. Estrogen and the skeleton. Trends Endocrinol. Metab. 2012;23:576–581. doi: 10.1016/j.tem.2012.03.008. - DOI - PMC - PubMed
    1. Fuentes N., Silveyra P. Estrogen receptor signaling mechanisms. Adv. Protein Chem. Struct. Biol. 2019;116:135–170. doi: 10.1016/bs.apcsb.2019.01.001. - DOI - PMC - PubMed
    1. Khatpe A., Adebayo A., Herodotou C., Kumar B., Nakshatri H. Nexus between PI3K/AKT and estrogen receptor signaling in breast cancer. Cancers. 2021;13:369. doi: 10.3390/cancers13030369. - DOI - PMC - PubMed

LinkOut - more resources