

Modeling Electrochemical Impedance Spectroscopy Using Time-Dependent Finite Element Method
- PMID: 39599041
- PMCID: PMC11597960
- DOI: 10.3390/s24227264
Modeling Electrochemical Impedance Spectroscopy Using Time-Dependent Finite Element Method
Abstract
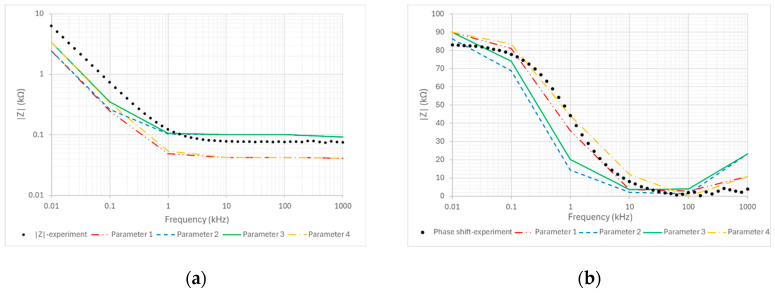
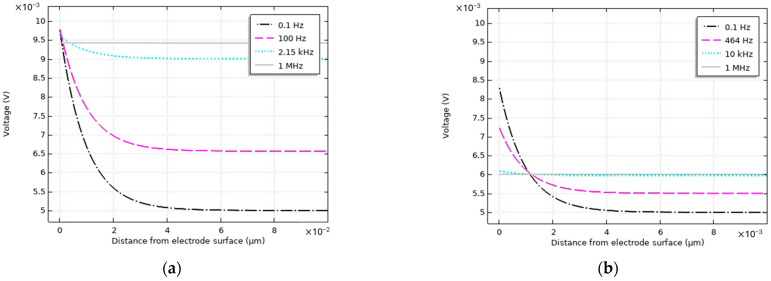
A time-dependent electrochemical impedance spectroscopy (EIS) model is presented using the finite element method (FEM) to simulate a 2D interdigitated electrode in an aqueous NaCl electrolyte. Developed in COMSOL Multiphysics, the model incorporates ion transport, electric field distribution, Stern layer effects, and electrode sheet resistance, governed by the Poisson and Nernst-Planck equations. This model can predict the transient current response to an applied excitation voltage, which gives information about the dynamics of the electrochemical system. The simulation results are compared with the experimental data, reproducing key features of the measurements. The transient current response indicates the need for multiple excitation cycles to stabilize the impedance measurement. At low frequencies (<1 kHz), the voltage drop at the Stern layer is significant, while at higher frequencies (>100 kHz), the voltage drop due to sheet resistance dominates. Moreover, the amplitude of the excitation voltage influences the EIS measurement, higher amplitudes (above 0.1 V) lead to non-linear impedance behavior, particularly at low ion concentrations. Discrepancies at low frequencies suggest that Faradaic processes may need to be incorporated for improved accuracy. Overall, this model provides quantitative insights for optimizing EIS sensor design and highlights critical factors for high-frequency and low-concentration conditions, laying the foundation for future biosensing applications with functionalized electrodes.
Keywords: COMSOL model; electrochemical impedance spectroscopy; finite element method; simulations; time-dependent analysis.
Conflict of interest statement
The authors declare no conflicts of interest.
Figures


References
-
- Upasham S., Banga I.K., Jagannath B., Paul A., Lin K.-C., Muthukumar S., Prasad S. Electrochemical Impedimetric Biosensors, Featuring the Use of Room Temperature Ionic Liquids (RTILs): Special Focus on Non-Faradaic Sensing. Biosens. Bioelectron. 2021;177:112940. doi: 10.1016/j.bios.2020.112940. - DOI - PubMed
-
- Burinaru T.A., Adiaconiţă B., Avram M., Preda P., Enciu A.-M., Chiriac E., Mărculescu C., Constantin T., Militaru M. Electrochemical Impedance Spectroscopy Based Microfluidic Biosensor for the Detection of Circulating Tumor Cells. Mater. Today Commun. 2022;32:104016. doi: 10.1016/j.mtcomm.2022.104016. - DOI
-
- Muñoz J., Montes R., Baeza M. Trends in Electrochemical Impedance Spectroscopy Involving Nanocomposite Transducers: Characterization, Architecture Surface and Bio-Sensing. TrAC Trends Anal. Chem. 2017;97:201–215. doi: 10.1016/j.trac.2017.08.012. - DOI
Grants and funding
LinkOut - more resources
Full Text Sources
