

Skin Phototype Classification with Machine Learning Based on Broadband Optical Measurements
- PMID: 39599172
- PMCID: PMC11598237
- DOI: 10.3390/s24227397
Skin Phototype Classification with Machine Learning Based on Broadband Optical Measurements
Abstract
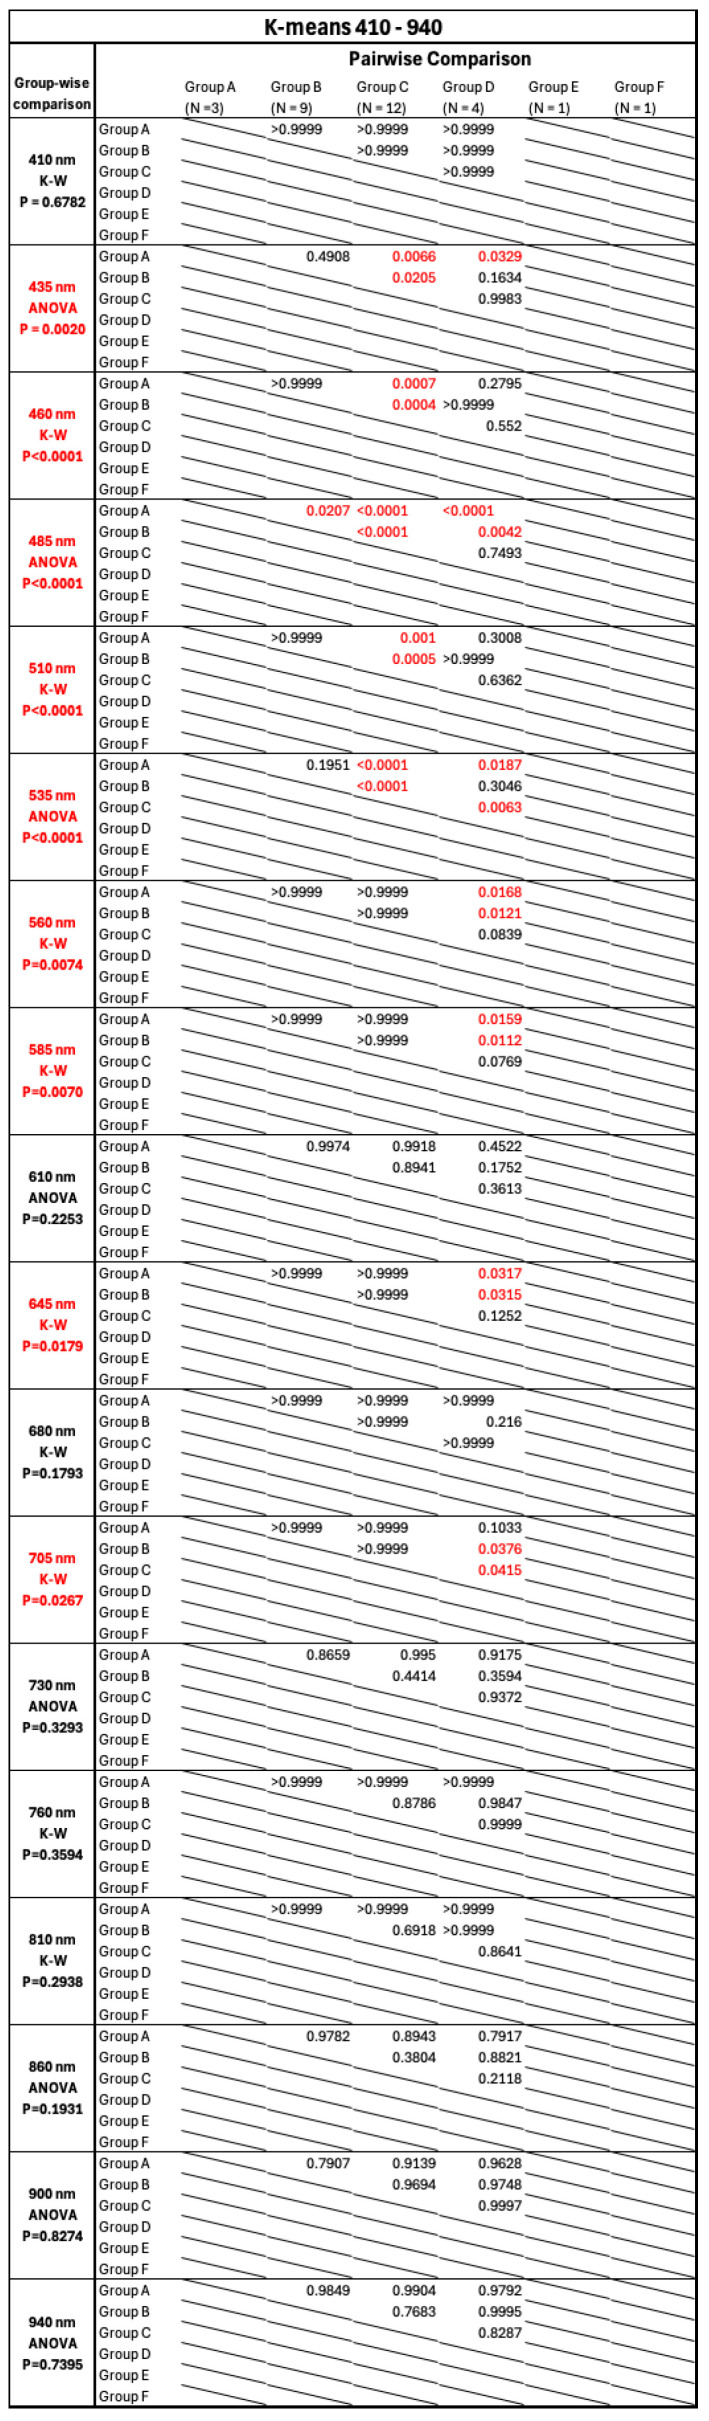
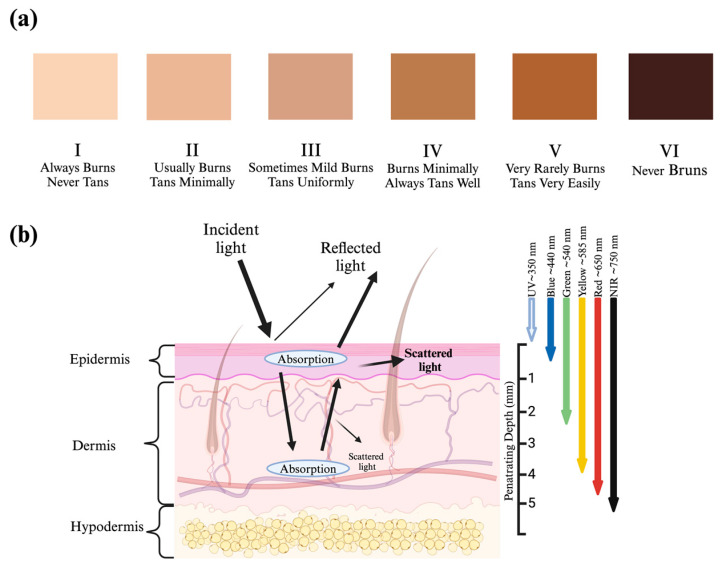
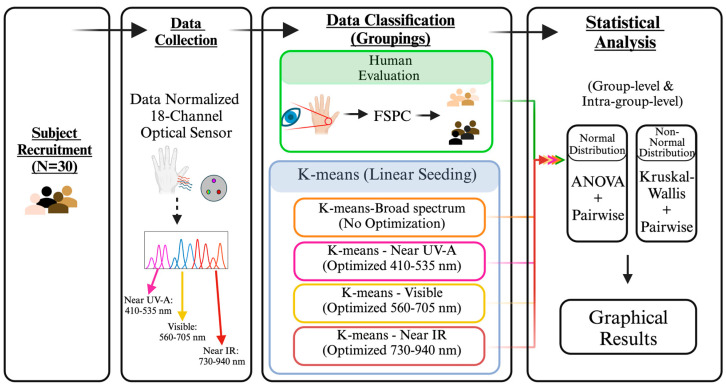
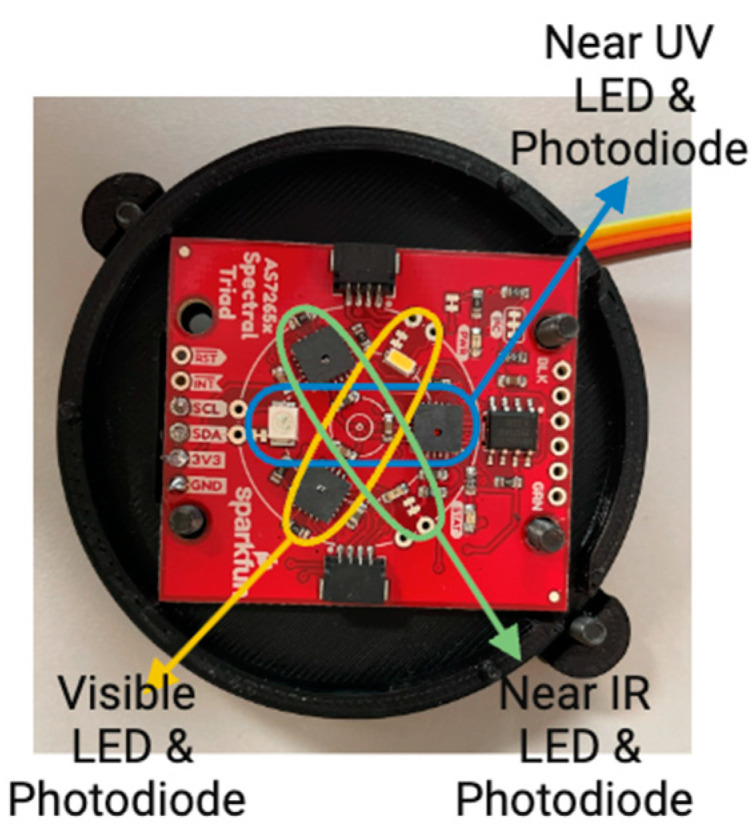
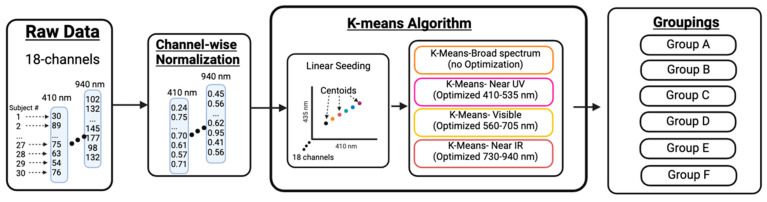
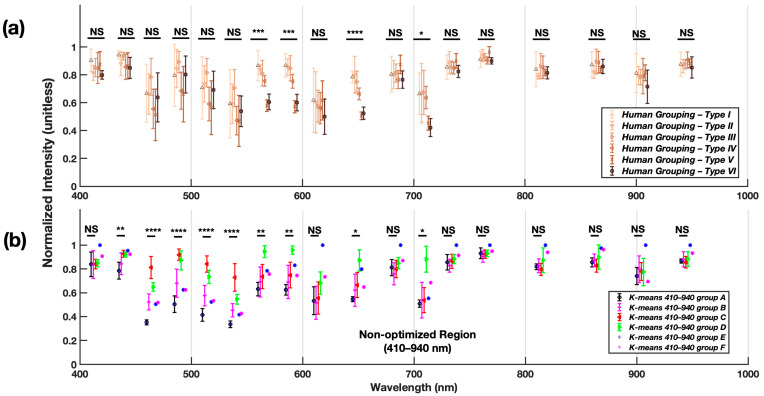
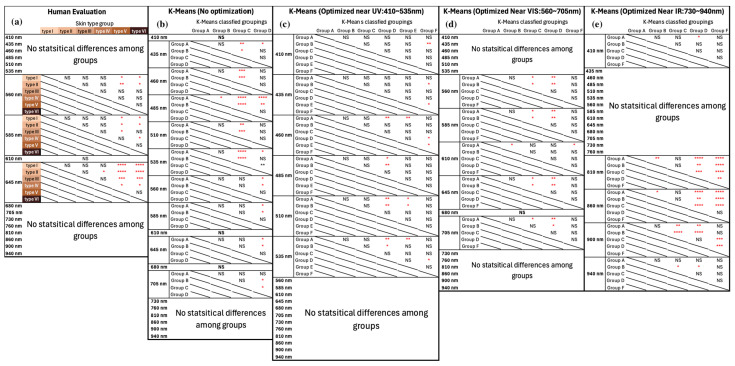
The Fitzpatrick Skin Phototype Classification (FSPC) scale is widely used to categorize skin types but has limitations such as the underrepresentation of darker skin phototypes, low classification resolution, and subjectivity. These limitations may contribute to dermatological care disparities in patients with darker skin phototypes, including the misdiagnosis of wound healing progression and escalated dermatological disease severity. This study introduces (1) an optical sensor measuring reflected light across 410-940 nm, (2) an unsupervised K-means algorithm for skin phototype classification using broadband optical data, and (3) methods to optimize classification across the Near-ultraviolet-A, Visible, and Near-infrared spectra. The differentiation capability of the algorithm was compared to human assessment based on FSPC in a diverse participant population (n = 30) spanning an even distribution of the full FSPC scale. The FSPC assessment distinguished between light and dark skin phototypes (e.g., FSPC I vs. VI) at 560, 585, and 645 nm but struggled with more similar phototypes (e.g., I vs. II). The K-means algorithm demonstrated stronger differentiation across a broader range of wavelengths, resulting in better classification resolution and supporting its use as a quantifiable and reproducible method for skin type classification. We also demonstrate the optimization of this method for specific bandwidths of interest and their associated clinical implications.
Keywords: Fitzpatrick skin type; K-means clustering; dermatology; machine learning; skin optical properties; skin type classification.
Conflict of interest statement
K.G.O. and M.A.M. are affiliated with Penderia Technologies, which is a co-inventor of the technology described in this paper.
Figures


Similar articles
-
Validity of the Fitzpatrick Skin Phototype Classification in Ecuador.Adv Skin Wound Care. 2020 Dec;33(12):1-5. doi: 10.1097/01.ASW.0000721168.40561.a3. Adv Skin Wound Care. 2020. PMID: 33208633 Free PMC article.
-
Prospective ex-vivo study on thermal effects in human skin phototypes II, IV and VI: a comparison between the 808, 1064, 1210 and 1320-nm diode laser.J Cosmet Laser Ther. 2012 Feb;14(1):7-13. doi: 10.3109/14764172.2011.634419. J Cosmet Laser Ther. 2012. PMID: 22129159
-
Optical Properties of Human Skin Phototypes and Their Correlation with Individual Angle Typology.Photobiomodul Photomed Laser Surg. 2023 Apr;41(4):175-181. doi: 10.1089/photob.2022.0111. Photobiomodul Photomed Laser Surg. 2023. PMID: 37074306
-
Optimisation of skin phototype classification.Pigment Cell Melanoma Res. 2023 Nov;36(6):468-471. doi: 10.1111/pcmr.13110. Epub 2023 Aug 7. Pigment Cell Melanoma Res. 2023. PMID: 37550876 Review.
-
Complications of dermatologic lasers in high Fitzpatrick phototypes and management: an updated narrative review.Lasers Med Sci. 2024 Jun 5;39(1):149. doi: 10.1007/s10103-024-04100-4. Lasers Med Sci. 2024. PMID: 38834924 Review.
Cited by
-
Microneedles for Melanoma Therapy: Exploring Opportunities and Challenges.Pharmaceutics. 2025 Apr 28;17(5):579. doi: 10.3390/pharmaceutics17050579. Pharmaceutics. 2025. PMID: 40430871 Free PMC article. Review.
References
-
- Monk E.P. The Unceasing Significance of Colorism: Skin Tone Stratification in the United States. Daedalus. 2021;150:76–90. doi: 10.1162/daed_a_01847. - DOI
-
- Mitchell M., Wu S., Zaldivar A., Barnes P., Vasserman L., Hutchinson B., Spitzer E., Raji I.D., Gebru T. Model Cards for Model Reporting; Proceedings of the Conference on Fairness, Accountability, and Transparency; Atlanta, GA, USA. 29–31 January 2019; pp. 220–229.
MeSH terms
Grants and funding
LinkOut - more resources
Full Text Sources
