. 2024 Nov 13;13(22):3180.
doi: 10.3390/plants13223180.

Exploring the Correlation Between Salt Tolerance and Seed Nutritional Value of Different Quinoa Genotypes Grown Under Saharan Climatic Conditions

Affiliations

Exploring the Correlation Between Salt Tolerance and Seed Nutritional Value of Different Quinoa Genotypes Grown Under Saharan Climatic Conditions

Rahma Goussi et al. Plants (Basel). .

Abstract

Quinoa is an annual pseudocereal highly adapted to extreme environments and has become, at this point in time, an extremely popular food due to its exceptional and high nutritional quality. This study aims to investigate the association of quinoa salt tolerance at an early developmental stage with its grain nutritional value under the effect of severe climatic hurdles. The current findings revealed a significant variability between genotypes in salt response attributes at the first development stage, where genotypes Amarilla Sacaca (thereafter, A. Sacaca) and QQ57 exhibited high salt tolerance thresholds with a low salt sensitivity index (SI), and a high capacity for Na+ sequestration into vacuoles. A significant positive association was detected between salt tolerance degree and yield parameters, saponins (SAPs), and minerals contents, where genotype A. Sacaca exhibited the highest SAP content with 3.84 mg.g-1 and the highest amounts of K, Ca, P, and Fe. The analysis of fatty acid composition demonstrated a high significant negative correlation between crude fat content and salt SI, and between yield parameters. Despite its low harvest index (HI) and low seed oil content, the salt-tolerant genotype A. Sacaca showed a high nutritional quality for seed oil according to its lowest ω6/ω3 ratio (5.6/1) and lowest level of atherogenicity index (AI). The genotype 115R, defined as the most sensitive to salt stress, exhibited a high seed oil quality due to its low lipid peroxidation susceptibility as reflected by its oxidative susceptibility and peroxidizability indexes. The significance of this study includes the identification of valuable quinoa genotypes showing high efficiency in growth and yield under severe stress accompanied by a high nutritional value satisfying the market requirements for healthy, nutritious, and safe food products.

Keywords: SAPs; fatty acids; nutritional value; salt tolerance; variability.


Conflict of interest statement

The authors declare no conflicts of interest.

Figures

Figure 1
Figure 1
Plant morphological aspects of five quinoa varieties (Amarilla Sacaca, QQ57, 115R, 27GR, and UDEC-2) cultivated under control (C) and sodium chloride (salt, S) treatment (300 mM NaCl). The left plant pot in each image represents the control (C) and the right pot displays the salt-treated plants (S).
Figure 2
Figure 2
Dry weight (DW) production of five quinoa varieties (Amarilla Sacaca, QQ57, 115R, 27GR, and UDEC-2) cultivated under control (C) and salt treatment (300 mM NaCl). Each data bar of the histogram represents the mean of 6 independent replicates measured on different randomly selected leaves (±SE). The alphabetic letters adjacent to the data bars reflect the significance level of the difference between, in one hand, the quinoa varieties, and, in the other hand, between control and salt-treated plants at a p-value < 0.05, based on Duncan’s multiple range tests at 95%.
Figure 3
Figure 3
Relative plant growth rate (RGR) (a). Shoot/root ratio (b). Reduction rate (%) of RGR and sensitivity index SI (c). Na+ content (d) in leaves and roots (meq.g−1 DW) of five quinoa varieties cultivated under salt treatment (300 mM NaCl). Each data bar represents the mean of 6 independent replicates (±SE). Means with similar letters are not different at p < 0.05 according to Duncan’s multiple range tests at 95%.
Figure 4
Figure 4
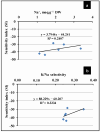
Correlation between sensitivity index (SI) and leaves’ Na+ content (a) or K/Na selectivity (b), of five quinoa varieties cultivated under salt treatment (300 mM NaCl). Data are means of 6 replicates measured on different leaf samples (±SE).
Figure 5
Figure 5
Mean comparison of grain nutritional value in five quinoa varieties (A. Sacaca, QQ57, 115R, 27GR, and UDEC-2). α-tocopherol (a). Saponins (b). Moisture (c). Oilseed yield and squalene content (d). Each data bar of the histogram represents the mean of 6 independent replicates (±SE). The alphabetic letters adjacent to the data bars reflect the significance level of the difference between quinoa varieties at a p-value < 0.05, based on Duncan’s multiple range tests at 95%.
Figure 6
Figure 6
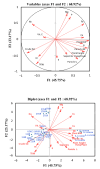
A principal component analysis (PCA) biplot depicting the relationship between the estimated variables (red color) and quinoa genotypes (blue color). F1 on the x-axis accounted for 45.7% of the total variability, while F2 explained 23.1% of total variability and is shown on the y-axis. Quinoa genotypes: A. Sacaca, QQ57, 115R, 27GR, and UDEC-2. Selected variables: sensitivity index, SI; plant height; plant DW; panicle length; panicle weight; seed yield/plant; thousand kernel weight, TKH; harvest index, HI; K, Ca; Mg; P; Fe; Na; vitamin E; saponins; and crude fat content.
Figure 7
Figure 7
Fatty acid composition of quinoa seeds (a). Mean values are shown for each quantified fatty acid, and the values are displayed as an average percentage (%) for five quinoa varieties. The fatty acids detected include the following compounds: myristic_C14:0, palmitic_C16:0, palmitoleic_C16:1, margaric_C17:0, margaroleic_C17:1, stearic_C18:0, oleic_C18:1, linoleic_C18:2, linolenic_C18:3, Arachidic_C20:0, gadoleic_C20:1, behenic_C22:0, erucic_C22:1 and Lignoceric_C24:0. Average content of polyunsaturated fatty acids (PUFA), monounsaturated fatty acids (MUFA), and saturated fatty acids (SFA) in seeds of five quinoa varieties (b). Relative concentrations (%) of different fatty acids (c) extracted and measured in five quinoa varieties (Amarilla Sacaca, QQ57, 115R, 27GR, and UDEC-2). N = 6 replicates per variety, and different letters indicate significant differences at p < 0.05.

References

    1. González J.A., Eisa S.S.S., Hussin S.A.E.S., Prado F.E. Quinoa: An Incan Crop to Face Global Changes in Agriculture Quinoa. In: Murphy K., Matanguihan J., editors. Quinoa: Improvement and Sustainable Production. John Wiley & Sons, Inc.; Hoboken, NJ, USA: 2015. pp. 1–18. - DOI
    1. Garcia M., Condori B., Del Castillo C. Agroecological and agronomic cultural practices of quinoa in South America. In: Murphy K., Matanguihan J., editors. Quinoa: Improvement and Sustainable Production. John Wiley & Sons, Inc.; Hoboken, NJ, USA: 2015. pp. 25–46. - DOI
    1. Valencia-Chamorro S.A. QUINOA. In: Caballero B., editor. Encyclopedia of Food Sciences and Nutrition. 2nd ed. Academic Press; Oxford, UK: 2003. pp. 4895–4902. - DOI
    1. Vidueiros S.M., Curti R.N., Dyner L.M., Binaghi M.J., Peterson G., Bertero H.D., Pallaro A.N. Diversity and interrelationships in nutritional traits in cultivated quinoa (Chenopodium quinoa Willd.) from Northwest Argentina. J. Cereal Sci. 2015;62:87–93. doi: 10.1016/j.jcs.2015.01.001. - DOI
    1. Filho A.M.M., Pirozi M.R., Borges J.T.D.S., Sant’Ana Pinheiro H.M., Chaves J.B.P., Coimbra J.S.D.R. Quinoa: Nutritional, functional, and antinutritional aspects. Crit. Rev. Food Sci. Nutr. 2017;57:1618–1630. doi: 10.1080/10408398.2014.1001811. - DOI - PubMed

LinkOut - more resources