

Characterization and Differentiation of Candida auris on Dixon's Agar Using Raman Spectroscopy
- PMID: 39599531
- PMCID: PMC11597615
- DOI: 10.3390/pathogens13110978
Characterization and Differentiation of Candida auris on Dixon's Agar Using Raman Spectroscopy
Abstract
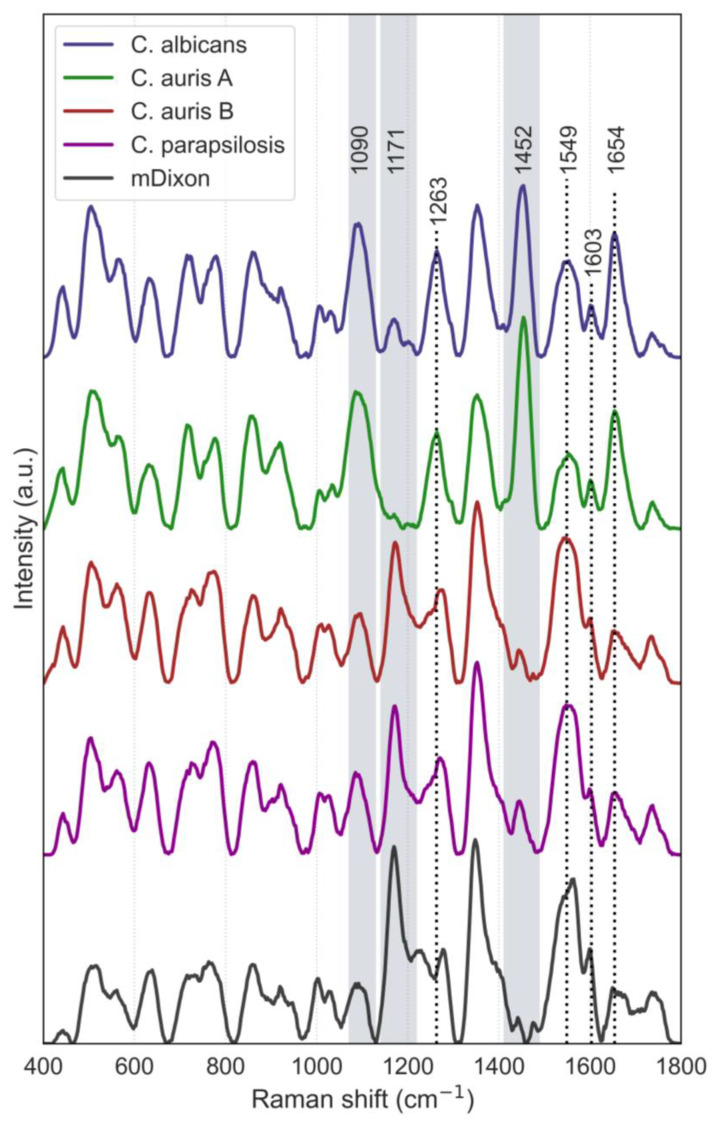
Candida auris, an emerging multidrug-resistant fungal pathogen, poses significant challenges in healthcare settings due to its high misidentification rate and resilience to treatments. Despite advancements in diagnostic tools, a gap remains in rapid, cost-effective identification methods that can differentiate C. auris from other Candida species, particularly on non-standard culture media. We used Raman spectroscopy to characterize C. auris grown on modified Dixon's agar (mDixon) and differentiated it from Candida albicans and Candida parapsilosis. Key Raman spectral markers at 1171 cm-1 and 1452 cm-1, linked to mannan and β-glucan composition, differentiated C. auris into two subgroups, A and B. Despite the spectral similarities of groups A and B with C. albicans and C. parapsilosis, respectively, all Candida species were distinguishable through principal component analysis (PCA). Additionally, this study is the first to demonstrate the distinct spectral signature of mDixon agar, achieved through spatially offset Raman spectroscopy (SORS), which enables accurate discrimination between the culture medium and fungal samples. The observed inter-individual variability within C. auris, coupled with the spectral overlap between C. auris subgroups and other Candida species, highlights a major challenge in differentiating closely related fungi due to their similar molecular composition. Enhancements in spectral resolution and further fluorescence minimization from the culture medium are needed to reliably detect the subtle biochemical differences within these species. Despite these challenges, the results underscore the potential of Raman spectroscopy as a real-time, non-destructive, and complementary tool for fungal pathogen identification.
Keywords: Raman spectroscopy; SORS; candida; candida auris; modified Dixon’s agar; spatially offset Raman spectroscopy.
Conflict of interest statement
Authors A.V., A.S. and I.M. were employed by Bioiatriki Healthcare Group. The remaining authors declare that the research was conducted in the absence of any commercial or financial relationships that could be construed as a potential conflict of interest. All authors confirm that all analyses and conclusions have been conducted with full academic independence.
Figures


Similar articles
-
Application of Raman spectroscopy and machine learning for Candida auris identification and characterization.Appl Environ Microbiol. 2024 Nov 20;90(11):e0102524. doi: 10.1128/aem.01025-24. Epub 2024 Oct 29. Appl Environ Microbiol. 2024. PMID: 39470219 Free PMC article.
-
Evaluation of usage of readily accessible Enterobacteriaceae differential and selective media for identifying Candida auris.Diagn Microbiol Infect Dis. 2025 Jan;111(1):116589. doi: 10.1016/j.diagmicrobio.2024.116589. Epub 2024 Oct 30. Diagn Microbiol Infect Dis. 2025. PMID: 39514952
-
Enhancing ICU Candida spp. surveillance: a cost-effective approach focused on Candida auris detection.Front Cell Infect Microbiol. 2024 Nov 1;14:1463456. doi: 10.3389/fcimb.2024.1463456. eCollection 2024. Front Cell Infect Microbiol. 2024. PMID: 39554808 Free PMC article.
-
Candida auris-the growing menace to global health.Mycoses. 2019 Aug;62(8):620-637. doi: 10.1111/myc.12904. Epub 2019 Jun 18. Mycoses. 2019. PMID: 30773703 Review.
-
Comprehensive Overview of Candida auris: An Emerging Multidrug-Resistant Fungal Pathogen.J Microbiol Biotechnol. 2024 Jul 28;34(7):1365-1375. doi: 10.4014/jmb.2404.04040. Epub 2024 Jun 15. J Microbiol Biotechnol. 2024. PMID: 38881183 Free PMC article. Review.
Cited by
-
Resilience in Resistance: The Role of Cell Wall Integrity in Multidrug-Resistant Candida.J Fungi (Basel). 2025 Apr 1;11(4):271. doi: 10.3390/jof11040271. J Fungi (Basel). 2025. PMID: 40278091 Free PMC article. Review.
References
-
- WHO . Fungal Priority Pathogens List to Guide Research, Development and Public Health Action. World Health Organization; Geneva, Switzerland: 2022.
MeSH terms
Substances
LinkOut - more resources
Full Text Sources
Miscellaneous
