. 2024 Nov 7;16(22):3810.
doi: 10.3390/nu16223810.

Lactobacillus plantarum and Bifidobacterium longum Alleviate High-Fat Diet-Induced Obesity and Depression/Cognitive Impairment-like Behavior in Mice by Upregulating AMPK Activation and Downregulating Adipogenesis and Gut Dysbiosis

Affiliations

Lactobacillus plantarum and Bifidobacterium longum Alleviate High-Fat Diet-Induced Obesity and Depression/Cognitive Impairment-like Behavior in Mice by Upregulating AMPK Activation and Downregulating Adipogenesis and Gut Dysbiosis

Soo-Won Yun et al. Nutrients. .

Abstract

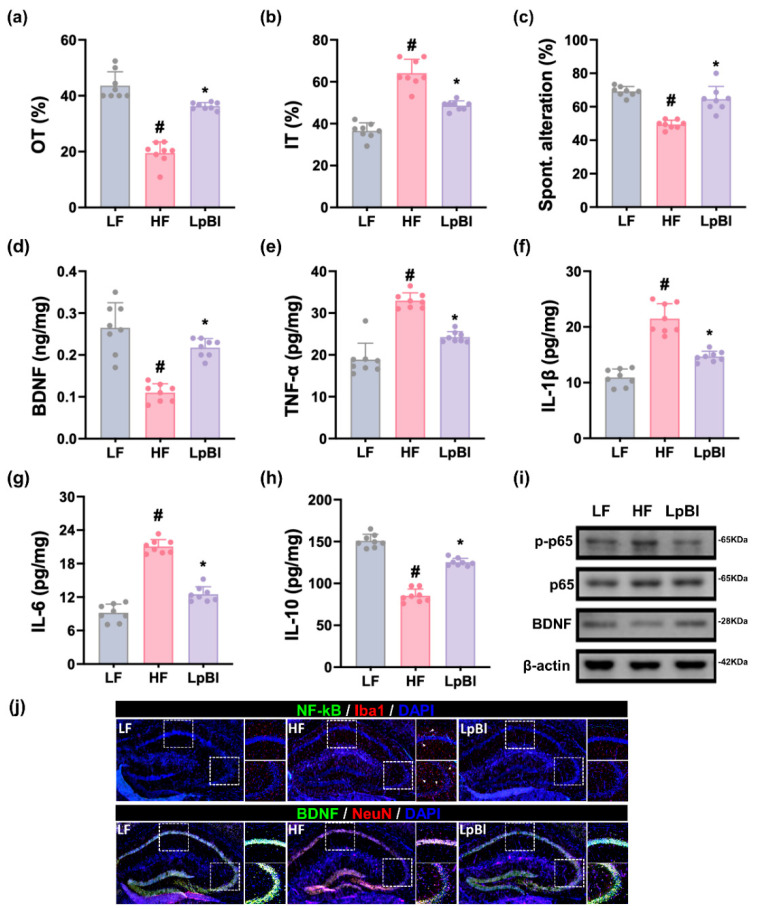
Background/Objective: Long-term intake of a high-fat diet (HFD) leads to obesity and gut dysbiosis. AMP-activated protein kinase (AMPK) is a key regulator of energy metabolism. Herein, we investigated the impacts of Lactobacillus (Lactiplantibacillus) plantarum P111 and Bifidobacterium longum P121, which suppressed dexamethasone-induced adipogenesis in 3T3 L1 cells and increased lipopolysaccharide-suppressed AMPK activation in HepG2 cells, on HFD-induced obesity, liver steatosis, gut inflammation and dysbiosis, and depression/cognitive impairment (DCi)-like behavior in mice. Methods: Obesity is induced in mice by feeding with HFD. Biomarker levels were measured using immunoblotting, enzyme-linked immunosorbent assay, and immunofluorescence staining. Results: Orally administered P111, P121, or their mix LpBl decreased HFD-induced body weight gain, epididymal fat pad weight, and triglyceride (TG), total cholesterol (TC), and lipopolysaccharide levels in the blood. Additionally, they downregulated HFD-increased NF-κB activation and TNF-α expression in the liver and colon, while HFD-decreased AMPK activation was upregulated. They also suppressed HFD-induced DCi-like behavior and hippocampal NF-κB activation, NF-κB-positive cell population, and IL-1β and TNF-α levels, while increasing the hippocampal BDNF-positive cell population and BDNF level. The combination of P111 and P122 (LpBl) also improved body weight gain, liver steatosis, and DCi-like behavior. LpBl also mitigated HFD-induced gut dysbiosis: it decreased Desulfovibrionaceae, Helicobacteriaceae, Coriobacteriaceae, and Streptococcaceae populations and lipopolysaccharide production, which were positively correlated with TNF-α expression; and increased Akkermansiaceae, Bifidobacteriaceae, and Prevotellaceae populations, which were positively correlated with the BDNF expression. Conclusions: P111 and/or P121 downregulated adipogenesis, gut dysbiosis, and NF-κB activation and upregulatde AMPK activation, leading to the alleviation of obesity, liver steatosis, and DCi.

Keywords: Bifidobacterium longum; Lactobacillus plantarum; gut microbiota; liver steatosis; obesity; psychiatric disorder.


Conflict of interest statement

Author Dong-Hyun Kim was employed by the company PBLbioLab, Inc. The remaining authors declare that the research was conducted in the absence of any commercial or financial relationships that could be construed as a potential conflict of interest.

Figures

Figure 1
Figure 1
Effects of P111 and P121 on fat (lipid) deposition and AMPK activation in 3T3 L1 and HepG2 cells. (a) Effects on fat deposition in 3T3 L1 cells. Nc, vehicle alone; Dex, dexamethasone; Lpl, P111+dexamethasone; Blo, P121+dexamethasone. (b) Effects on fat deposition in HepG2 cells. Nc, vehicle alone; PA, palmitic acid; Lpl, P111+palmitic acid; Blo, P121+palmitic acid. (c) Effects on AMPK activation in HepG2 cells. Nc, vehicle alone; LPS, lipopolysaccharide (LPS); Lpl, P111+LPS; Blo, P121+LPS. Fat deposition and AMPK activation were assessed by Oil Red O staining and immunoblotting, respectively. 3T3 L1 cells were treated with probiotics (1 × 10⁵ CFU/mL) and dexamethasone. HepG2 cells were treated with probiotics (1 × 10⁵ CFU/mL) and palmitic acid. (n = 4). # p < 0.05 vs. NC. * p < 0.05 vs. Dex or PA alone.
Figure 2
Figure 2
Effects of P111 and P121 on HFD-increased obesity in mice. Effects on body weight change (a), body weight gain (b), EFP weight (c), and EFP adipocyte size (d). Effects on TG (e), TC (f), and HC levels (g) in the blood. Effects on IL-6 (h), corticosterone (CORT, (i)), and LPS levels (j) in the blood. LF, LFD (8 weeks) alone; HF, HFD (8 weeks) alone; Lpl, P111 (4 weeks) with HFD (8 weeks); Blo, P121 (4 weeks) with HFD (8 weeks). n = 8. # p < 0.05 vs. LF group. * p < 0.05 vs. HF group.
Figure 3
Figure 3
Effects of P111 and P121 on liver weight and steatohepatitis-related marker expression in the liver. Effects on liver weight (a) and lipid droplet number (b). Effects on TG (c), TC (d), and HC (e). Effects on TNF-α (f), IL-1β (g), IL-6 (h), IL-10 (i), and LPS (j) levels, as assessed by ELISA. (k) Effects on p-p65, p65, p-AMPK, AMPK, and β-actin expression, as assessed by immunoblotting. (l) Effects on SIRT1, sREBP-1c, PGC-1a, LPL, Fiaf, G6PD, and FAS levels, as assessed by qPCR. LF, LFD (8 weeks) alone; HF, HFD (8 weeks) alone; Lpl, P111 (4 weeks) with HFD (8 weeks); Blo, P121 (4 weeks) with HFD (8 weeks). n = 8. # p < 0.05 vs. LF group. * p < 0.05 vs. HF group.
Figure 4
Figure 4
Effects of P111 and P121 on DCi-like symptoms in mice with HFD-induced obesity. Effects on OT in the EPMT (a), IT in the TST (b), and SA in the YMT (c). Effects on hippocampal BDNF (d), TNF-α (e), IL-1β (f), IL-6 (g), and IL-10 expression (h). (i) Effects on hippocampal p-p65, p65, BDNF, and β-actin expression. (j) Effects on hippocampal NF-κB+Iba1+ and BDNF+NeuN+ cell numbers. LF, LFD (8 weeks) alone; HF, HFD (8 weeks) alone; Lpl, P111 (4 weeks) with HFD (8 weeks); Blo, P121 (4 weeks) with HFD (8 weeks). n = 8. # p < 0.05 vs. LF group. * p < 0.05 vs. HF group.
Figure 5
Figure 5
Effects of P111 and P121 on HFD-induced colitis in mice. (a) Effects on colon length. Effects on colonic myeloperoxidase (MPO, (b)), TNF-α (c), IL-1β (d), IL-6 (e), and IL-10 expression (f), as assessed by ELISA. (g) Effects on colonic p-p65, p65, p-AMPK, AMPK, and β-actin expression, as assessed by immunoblotting. (h) Effects on colonic SIRT1 expression, as assessed by qPCR. (i) Effects on colonic NF-κB+CD11c+ cell populations. LF, LFD (8 weeks) alone; HF, HFD (8 weeks) alone; Lpl, P111 (4 weeks) with HFD (8 weeks); Blo, P121 (4 weeks) with HFD (8 weeks). n = 8. # p < 0.05 vs. LF group. * p < 0.05 vs. HF group.
Figure 6
Figure 6
Effect of LpBl on HFD-induced body weight, liver steatosis, and their related biomarker levels in mice. Effect on body weight change (a), body weight gain (b), EFP weight (c), and EFP adipocyte size (d). Effects on blood TG (e), TC (f), and HC levels (g). Effect on blood IL-6 (h), corticosterone (CORT, (i)), and LPS levels (j), as assessed by ELISA. LF, LFD (8 weeks) alone; HF, HFD (8 weeks) alone; LpBl, P111 and P121 mix (4 weeks) with HFD (8 weeks). n = 8. # p < 0.05 vs. LF group. * p < 0.05 vs. HF group.
Figure 7
Figure 7
Effect of LpBl (P111 and P121 (4:1) mix) on liver steatosis-related marker levels. Effects on liver weight (a) and lipid droplet number (b). Effects on liver TG (c), TC (d), and HC (e). Effects on liver TNF-α (f), IL-1β (g), IL-6 (h), IL-10 (i), and LPS levels (j), as assessed by ELISA. (k) Effects on liver p-p65, p65. P-AMPK, AMPK, and β-actin levels, as assessed by immunoblotting. (l) Effects on liver SIRT1, sREBP-1c, PGC-1a, LPL, Fiaf, G6PD, and FAS levels, as assessed by qPCR. LF, LFD (8 weeks) alone; HF, HFD (8 weeks) alone; LpBl, P111 and P121 mix (4 weeks) with HFD (8 weeks). n = 8. # p < 0.05 vs. LF group. * p < 0.05 vs. HF group.
Figure 8
Figure 8
Effect of LpBl on HFD-induced DCi in mice. Effects on OT (a) in EPMT, IT in TST (b), and SA in YMT (c). Effect on hippocampal BDNF (d), TNF-α (e), IL-1β (f), IL-6 (g), and IL-10 levels (h), as assessed by ELISA. (i) Effect on hippocampal p-p65, p65, BDNF, and β-actin levels, as assessed by immunoblotting. (j) Effect on hippocampal NF-κB+Iba1+ and BDNF+NeuN+ cell number, as assessed by the confocal microscope. LF, LFD (8 weeks) alone; HF, HFD (8 weeks) alone; LpBl, P111 and P121 mix (4 weeks) with HFD (8 weeks). n = 8. # p < 0.05 vs. LF group. * p < 0.05 vs. HF group.
Figure 9
Figure 9
Effect of LpBl on HFD-induced gut inflammation in mice. (a) Effect on colon length. Effect on colonic myeloperoxidase (MPO, (b)), TNF-α (c), IL-1β (d), IL-6 (e), and IL-10 levels (f), as assessed by ELISA. (g) Effect on colonic p-p65, p65, p-AMPK, AMPK, and β-actin levels, as assessed by immunoblotting. (h) Effect on colonic SIRT1 level, as assessed by qPCR. (i) Effect on colonic NF-κB+CD11c+ cell number. LF, LFD (8 weeks) alone; HF, HFD (8 weeks) alone; LpBl, P111, and P121 mix (4 weeks) with HFD (8 weeks). n = 8. # p < 0.05 vs. LF group. * p < 0.05 vs. HF group.
Figure 10
Figure 10
Effect of LpBl on HFD-induced gut dysbiosis in mice. Effect on the composition of fecal microbiota: (a) phylum and (b) family levels; (c) OTU (α-diversity); and (d) β-diversity (PCoA plot). (e) Effects on fecal microbiota LPS level. Network analysis between gut microbiota and body weight gain (WG, (f)), IT in the TST (g), TNF-α (h), BDNF (i), or SIRT1 level (j). LF, LFD (8 weeks) alone; HF, HFD (8 weeks) alone; LpBl, P111, and P121 mix (4 weeks) with HFD (8 weeks). n = 8. # p < 0.05 vs. LF group. * p < 0.05 vs. HF group.

References

    1. Blüher M. Obesity: Global epidemiology and pathogenesis. Nat. Rev. Endocrinol. 2019;15:288–298. doi: 10.1038/s41574-019-0176-8. - DOI - PubMed
    1. Castro-Barquero S., Ruiz-León A.M., Sierra-Pérez M., Estruch R., Casas R. Dietary Strategies for Metabolic Syndrome: A Comprehensive Review. Nutrients. 2020;12:2983. doi: 10.3390/nu12102983. - DOI - PMC - PubMed
    1. Magkos F., Hjorth M.F., Astrup A. Diet and exercise in the prevention and treatment of type 2 diabetes mellitus. Nat. Rev. Endocrinol. 2020;16:545–555. doi: 10.1038/s41574-020-0381-5. - DOI - PubMed
    1. Zou J., Liu C., Jiang S., Qian D., Duan J. Cross Talk between Gut Microbiota and Intestinal Mucosal Immunity in the Development of Ulcerative Colitis. Infect. Immun. 2021;89:e0001421. doi: 10.1128/IAI.00014-21. - DOI - PMC - PubMed
    1. Wu D., Wang H., Xie L., Hu F. Cross-Talk Between Gut Microbiota and Adipose Tissues in Obesity and Related Metabolic Diseases. Front. Endocrinol. 2022;13:908868. doi: 10.3389/fendo.2022.908868. - DOI - PMC - PubMed

MeSH terms

Substances

LinkOut - more resources