. 2024 Nov 16;16(22):3919.
doi: 10.3390/nu16223919.

The Impact of a Ketogenic Diet on Late-Stage Pancreatic Carcinogenesis in Mice: Efficacy and Safety Studies

Affiliations

The Impact of a Ketogenic Diet on Late-Stage Pancreatic Carcinogenesis in Mice: Efficacy and Safety Studies

Natalia E Cortez et al. Nutrients. .

Abstract

Background: High-fat diets (HFDs) have been associated with an increased risk of pancreatic cancer. In contrast, ketogenic diets (KDs) have been shown to display anti-tumor characteristics. The objective of this work was to evaluate the efficacy of a KD on late-stage pancreatic carcinogenesis in a genetically modified mouse model of pancreatic cancer [LSL-KrasG12D/+; Ptf1-Cre (KC) mice], as well as its liver safety, and to compare it to that of an HFD.

Methods: Six-month-old female and male KC mice were randomly allocated to either a control diet (CD) (%kcal: 20% fat, 15% protein, 65% carbohydrates), an HFD (%kcal: 40% fat, 15% protein, 45% carbohydrate) or a KD (%kcal: 84% fat, 15% protein, 1% carbohydrate) and fed these diets for 6 months.

Results: HFD-fed, but not KD-fed, mice showed a 15% increase in body weight, plus elevated serum insulin (2.4-fold increase) and leptin (2.9-fold increase) levels, compared to CD-fed mice. At the pancreas level, no differences in pancreatic cancer incidence rates were observed among the diet groups. Regarding the liver safety profile, the HFD-fed mice had higher serum levels of alanine aminotransferase (ALT), aspartate aminotransferase (AST), and alkaline phosphatase (ALP), when compared to the CD and KD groups. In addition, upon histologic examination, an HFD, but not a KD, showed a ~2-fold increase in both macro- and microsteatosis, as well as 35% and 32% higher levels of TLR4 and NF-κB activation, respectively, compared to CD-fed mice.

Conclusions: In summary, although a KD intervention alone did not prevent pancreatic carcinogenesis, our data suggests that a KD modulates insulin signaling and hepatic lipid metabolism, highlighting its beneficial effects on healthspan and liver function when compared to an HFD.

Keywords: high-fat diet; ketogenic diet; pancreatic cancer; pancreatic carcinogenesis.


Conflict of interest statement

The authors declare no conflicts of interest. The funders had no role in the design of the study, analyses, interpretation of data, writing of the manuscript, or in the decision to publish the results.

Figures

Figure 1
Figure 1
Effect of an HFD and KD on body weight, body composition, and ketone body levels in KC mice. (A) Scheme of the study design. (B) Baseline and final body weight. (C) Fat and lean mass of KC mice fed a control diet (CD), high-fat diet (HFD), or ketogenic diet (KD) are shown. (D) β-hydroxybutyrate and glucose levels at the baseline and endpoint are presented. Values represent the mean with ± SD (n = 12–23 animals/group). * p < 0.05 and ** p < 0.01 were calculated using two-way ANOVA. Baseline and final levels were measured when KC mice were 6 and 12 months old, respectively.
Figure 2
Figure 2
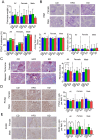
Effect of a KD and HFD on PDAC incidence rates in mice. (A) Pancreas weight of KC mice fed a control diet (CD), high-fat diet (HFD), or ketogenic diet (KD). (B) Pancreas histology using H&E-stained tissues of KC mice fed the control diet (CD), high-fat diet (HFD), or ketogenic diet (KD) in 12-month-old female and male KC mice. For each diet, images (×20) from female and male mice were shown. In addition, cancer incidence (%), acinar cell loss, and inflammation scores are shown. (C) Pancreas histology using Masson Trichrome-stained tissues of KC mice fed the control diet (CD), high-fat diet (HFD), or ketogenic diet (KD) in 12-month-old female and male KC mice. For each diet, images (×20) from female and male mice livers are shown, and fibrosis scores were quantified. (D) IHC for PCNA was performed on KC pancreas tissue sections, and photographs were taken at 20× magnification. Representative images are shown. (E) IHC for F4/80 was performed on KC pancreas tissue sections, and photographs were taken at 20× magnification. Representative images are shown. Results were expressed as a percentage of PCNA+ cells ± SD per × 20 fields (n = 7–14 animals/group/sex). * p < 0.05, data are depicted as mean with ± SD, one-way ANOVA.
Figure 3
Figure 3
An HFD significantly increased serum insulin and leptin levels compared to a KD. (A) Serum insulin and leptin levels after 6 months in their respective diets. (B) Cytokine and chemokine levels were measured in serum in 12-month-old KC mice fed either a control diet (CD), a high-fat diet (HFD), or a ketogenic diet (KD). * p < 0.05, and ** p < 0.01, data are depicted as mean with ± SD, one-way ANOVA (n = 5–12 animals/group/sex).
Figure 4
Figure 4
Effect of an HFD and KD on pathways downstream of insulin signaling. IHC for pERK and p4EBP1 was performed on KC pancreatic tissue sections, and photographs were taken at 20× magnification. Representative images are shown. Results were expressed as a percentage of pERK+ and p4EBP1+ cells ± SD per ×20 fields. Data are depicted as mean with ± SD, one-way ANOVA (n = 3–6 animals/group/sex).
Figure 5
Figure 5
An HFD, but not a KD, affects liver function in KC mice. (A) Final liver enzymes, protein, and (B) waste product levels were measured in 12-month-old KC mice fed either a control diet (CD), a high-fat diet (HFD), or a ketogenic diet (KD). * p < 0.05, and ** p < 0.01, data are depicted as mean with ± SD, one-way ANOVA (n = 3–7 animals/group/sex).
Figure 6
Figure 6
Effect of a KD on liver lipids accumulation. (A) Liver histology using H&E-stained tissues of KC mice fed the control diet (CD), high-fat diet (HFD), or ketogenic diet (KD) in 12-month-old female and male KC mice. For each diet, images (×20) from female and male mice were shown. Macrovesicular, microvesicular, and hypertrophy scores are shown. (B) Protein levels of fibrotic marker Col1A1 analyzed by western blotting in liver lysates from 12-month-old KC mice fed a CD, HFD, or KD. GADPH was used as a loading control. Each lane represents an individual mouse, and three mice per group are shown. Bands were quantified, and results are expressed as percentage control. * p < 0.05, data are depicted as mean with ± SD, one-way ANOVA (n = 4–6 animals/group/sex).
Figure 7
Figure 7
Effect of a KD on ketogenesis and glucose metabolism. Protein levels of HMGCL and HMGCS analyzed by western blotting in liver lysates from 12-month-old KC mice fed the control diet (CD), high-fat diet (HFD), or ketogenic diet (KD). Image shows representative immunoblots of HMGCL and HMGCS and protein levels of GADPH used as a loading control. Each lane represents an individual mouse, and three mice per group are shown. Bands were quantified, and results are expressed as percentage control. Data are depicted as mean with ± SD, one-way ANOVA (n = 4–6 animals/group/sex).
Figure 8
Figure 8
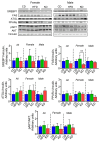
Effect of an HFD and KD on de novo lipogenesis. Protein levels of SREBP1, FAS, ATGL, PPARα, and pAKT analyzed by western blotting in liver lysates from 12-month-old KC mice fed the control diet (CD), high-fat diet (HFD), or ketogenic diet (KD). Image shows representative immunoblots of SREBP1, FAS, ATGL, PPARα, and pAKT and protein levels of vinculin used as a loading control. Each lane represents an individual mouse, and three mice per group are shown. Bands were quantified, and results are expressed as percentage control. ** p < 0.01, data are depicted as mean with ± SD, one-way ANOVA (n = 3–6 animals/group/sex).
Figure 9
Figure 9
Effect of a KD on markers of inflammation in the liver of KC mice. Protein levels of TLR2 and TLR4, and p-p65 analyzed by western blotting in liver lysates from 12-month-old KC mice fed a control diet (CD), high-fat diet (HFD), or ketogenic diet (KD). Image shows representative immunoblots of TLR2 and TLR4, and p-p65 and protein levels of vinculin used as a loading control. Each lane represents an individual mouse, and three mice per group are shown. Bands were quantified, and results are expressed as percentage control. * p < 0.05, data are depicted as mean with ± SD, one-way ANOVA (n = 4–6 animals/group/sex).

References

    1. Rahib L., Smith B.D., Aizenberg R., Rosenzweig A.B., Fleshman J.M., Matrisian L.M. Projecting cancer incidence and deaths to 2030: The unexpected burden of thyroid, liver, and pancreas cancers in the United States. Cancer Res. 2014;74:2913–2921. doi: 10.1158/0008-5472.CAN-14-0155. - DOI - PubMed
    1. Siegel R.L., Giaquinto A.N., Jemal A. Cancer statistics, 2024. CA A Cancer J. Clin. 2024;74:12–49. doi: 10.3322/caac.21820. - DOI - PubMed
    1. Storz P. Acinar cell plasticity and development of pancreatic ductal adenocarcinoma. Nat. Rev. Gastroenterol. Hepatol. 2017;14:296–304. doi: 10.1038/nrgastro.2017.12. - DOI - PMC - PubMed
    1. Brosens L.A., Hackeng W.M., Offerhaus G.J., Hruban R.H., Wood L.D. Pancreatic adenocarcinoma pathology: Changing “landscape”. J. Gastrointest. Oncol. 2015;6:358–374. doi: 10.3978/j.issn.2078-6891.2015.032. - DOI - PMC - PubMed
    1. Bernard V., Fleming J., Maitra A. Molecular and Genetic Basis of Pancreatic Carcinogenesis: Which Concepts May be Clinically Relevant? Surg. Oncol. Clin. N. Am. 2016;25:227–238. doi: 10.1016/j.soc.2015.11.003. - DOI - PubMed