. 2024 Nov 6;16(11):1743.
doi: 10.3390/v16111743.

Alteration of Gene Expression After Entecavir and Pegylated Interferon Therapy in HBV-Infected Chimeric Mouse Liver

Affiliations

Alteration of Gene Expression After Entecavir and Pegylated Interferon Therapy in HBV-Infected Chimeric Mouse Liver

Huarui Bao et al. Viruses. .

Abstract

Cross-sectional analyses using liver tissue from chronic hepatitis B patients make it difficult to exclude the influence of host immune responses. In this study, we performed next-generation sequencing using the livers of hepatitis B virus (HBV)-infected uPA/SCID mice with humanized livers before and after antiviral therapy (AVT) with entecavir and pegylated interferon, and then performed a comparative transcriptome analysis of gene expression alteration. After HBV infection, the expression of genes involved in multiple pathways was significantly altered in the HBV-infected livers. After AVT, the levels of 37 out of 89 genes downregulated by HBV infection were restored, and 54 of 157 genes upregulated by HBV infection were suppressed. Interestingly, genes associated with hypoxia and KRAS signaling were included among the 54 genes upregulated by HBV infection and downregulated by AVT. Several genes associated with cell growth or carcinogenesis via hypoxia and KRAS signaling were significantly downregulated by AVT, with a potential application for the suppression of hepato-carcinogenesis.

Keywords: antiviral therapy; gene expression; hepatitis B virus; human hepatocyte; next-generation sequencing.


Conflict of interest statement

The authors declare no conflicts of interest. All the authors have submitted the ICMJE Form for Disclosure of Potential Conflicts of Interest. Conflicts that the editors consider relevant to the content of the manuscript have been disclosed.

Figures

Figure 1
Figure 1
HBV viral load level in the livers of the HBV-infected uPA/SCID mice with humanized livers before and after antiviral therapy with entecavir and pegylated interferon. (a) Experimental schematic: Group 1, five non-infected mice were sacrificed to assess baseline gene expression; Group 2, three HBV-infected mice were inoculated with 6.0 × 10⁶ copies of HBV via the mouse tail vein, and sacrificed after the HBV DNA level had plateaued; Group 3, the remaining three HBV-infected mice were treated with entecavir plus PEG-IFNα2a until HBV DNA became undetectable. (b) Three HBV-infected mice in Group 2 were sacrificed after the HBV DNA levels had plateaued. Three HBV-infected mice in Group 3 were sacrificed after HBV DNA fell below detectable levels following AVT with entecavir plus pegylated interferon. (c) Intrahepatic HBV RNA levels (mean + SD) were measured by real-time PCR and were compared among the three groups. Statistical analysis was performed by an ANOVA test.
Figure 2
Figure 2
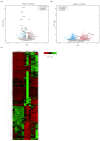
Altered gene expression profiles of intrahepatic gene expression between the HBV-infected and uninfected mice. (a,b) Alterations of all genes are shown by volcano plot; (a) Group 1 vs. Group 2; (b) Group 2 vs. Group 3. (c) Heatmap of differentially expressed genes (DEGs) between Group 1 (uninfected mice), Group 2 (HBV-infected mice), and Group 3 (HBV-infected mice with antiviral therapy) in the RNA-seq analysis are shown. Each column represents a mouse, and each line represents a DEG. Gene expression levels differed significantly among Groups 1, 2, and 3 (p value < 0.01). Genes are ranked based on z-score. Red, downregulated; green, upregulated.
Figure 3
Figure 3
Pathways associated with the recovery of gene expression following antiviral therapy. A gene set enrichment analysis was performed using the set of genes for which expression recovered following AVT. Filled squares indicate the DEGs associated with Hallmark gene sets. Note: BGN, biglycan; MT2A, metallothionein 2A; IGFBP1, insulin-like growth factor-binding protein 1; DUSP1, dual-specificity protein phosphatase 1; MT1E, metallothionein 1E; ANGPTL4, angiopoietin-like 4; GPC3, glypican 3; DDIT4, DNA damage-inducible transcript 4; MXI1, MAX interactor 1; COL3A1, collagen type III alpha 1 chain; COL1A1, collagen type I alpha 1 chain; GADD45B, growth arrest and DNA damage-inducible protein (GADD) 45 beta; SPARC, secreted protein acidic and rich in cysteine; COL1A2, collagen type I alpha 2 chain; CXCL12, C-X-C motif chemokine ligand 12; TST, thiosulfate sulfurtransferase; DES, desmin; IGFBP7, insulin-like growth factor-binding protein 7; MARCKS, myristoylated alanine-rich protein kinase C substrate; PLK1, Polo-like kinase 1; CCNB2, cyclin B2; PTTG1, pituitary tumor-transforming gene 1; CCNA2, cyclin A2; ETS2, ETS proto-oncogene 2; GABARAP, GABA type A receptor-associated protein; FMO1, flavin-containing dimethylaniline monoxygenase 1; GSPT1, G1 to S phase transition 1; SERPINA3, serpin family A member 3; CPE, carboxypeptidase E; SNX10, sorting nexin 10; ASS1, argininosuccinate synthase 1; PLAGL1, PLAG1-like zinc finger 1; RRM2, ribonucleotide reductase regulatory subunit M2.
Figure 4
Figure 4
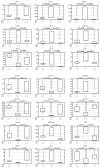
Expression of the genes associated with the recovered pathways. Dynamic changes in gene expression level in the non-infected mice, HBV-infected mice, and HBV-infected mice after antiviral therapy. Note: BGN, biglycan; MT2A, metallothionein 2A; IGFBP1, insulin-like growth factor-binding protein 1; DUSP1, dual-specificity protein phosphatase 1; MT1E, metallothionein 1E; ANGPTL4, angiopoietin-like 4; GPC3, glypican 3; DDIT4, DNA damage-inducible transcript 4; MXI1, MAX interactor 1; COL3A1, collagen type III alpha 1 chain; COL1A1, collagen type I alpha 1 chain; GADD45B, growth arrest and DNA damage-inducible protein (GADD) 45 beta; SPARC, secreted protein acidic and rich in cysteine; COL1A2, collagen type I alpha 2 chain; CXCL12, C-X-C motif chemokine ligand 12; TST, thiosulfate sulfurtransferase; DES, desmin; IGFBP7, insulin-like growth factor-binding protein 7; MARCKS, myristoylated alanine-rich protein kinase C substrate; PLK1, Polo-like kinase 1; CCNB2, cyclin B2; PTTG1, pituitary tumor-transforming gene 1; CCNA2, cyclin A2; ETS2, ETS proto-oncogene 2; GABARAP, GABA type A receptor-associated protein; FMO1, flavin-containing dimethylaniline monoxygenase 1; GSPT1, G1 to S phase transition 1; SERPINA3, serpin family A member 3; CPE, carboxypeptidase E; SNX10, sorting nexin 10; ASS1, argininosuccinate synthase 1; PLAGL1, PLAG1-like zinc finger 1; RRM2, ribonucleotide reductase regulatory subunit M2.
Figure 4
Figure 4
Expression of the genes associated with the recovered pathways. Dynamic changes in gene expression level in the non-infected mice, HBV-infected mice, and HBV-infected mice after antiviral therapy. Note: BGN, biglycan; MT2A, metallothionein 2A; IGFBP1, insulin-like growth factor-binding protein 1; DUSP1, dual-specificity protein phosphatase 1; MT1E, metallothionein 1E; ANGPTL4, angiopoietin-like 4; GPC3, glypican 3; DDIT4, DNA damage-inducible transcript 4; MXI1, MAX interactor 1; COL3A1, collagen type III alpha 1 chain; COL1A1, collagen type I alpha 1 chain; GADD45B, growth arrest and DNA damage-inducible protein (GADD) 45 beta; SPARC, secreted protein acidic and rich in cysteine; COL1A2, collagen type I alpha 2 chain; CXCL12, C-X-C motif chemokine ligand 12; TST, thiosulfate sulfurtransferase; DES, desmin; IGFBP7, insulin-like growth factor-binding protein 7; MARCKS, myristoylated alanine-rich protein kinase C substrate; PLK1, Polo-like kinase 1; CCNB2, cyclin B2; PTTG1, pituitary tumor-transforming gene 1; CCNA2, cyclin A2; ETS2, ETS proto-oncogene 2; GABARAP, GABA type A receptor-associated protein; FMO1, flavin-containing dimethylaniline monoxygenase 1; GSPT1, G1 to S phase transition 1; SERPINA3, serpin family A member 3; CPE, carboxypeptidase E; SNX10, sorting nexin 10; ASS1, argininosuccinate synthase 1; PLAGL1, PLAG1-like zinc finger 1; RRM2, ribonucleotide reductase regulatory subunit M2.

References

    1. World Health Organization . Global Progress Report on HIV, Viral Hepatitis and Sexually Transmitted Infections. World Health Organization; Geneva, Switzerland: 2021.
    1. Conjeevaram H.S., Lok A.S. Management of chronic hepatitis B. J. Hepatol. 2003;38((Suppl. S1)):S90–S103. doi: 10.1016/S0168-8278(02)00431-2. - DOI - PubMed
    1. Kumada H., Okanoue T., Onji M., Moriwaki H., Izumi N., Tanaka E., Chayama K., Sakisaka S., Takehara T., Oketani M., et al. Guidelines for the treatment of chronic hepatitis and cirrhosis due to hepatitis B virus infection for the fiscal year 2008 in Japan. Hepatol. Res. 2010;40:1–7. doi: 10.1111/j.1872-034X.2009.00633.x. - DOI - PubMed
    1. Lee Y., Suh D.J., Lim Y., Jung S.W., Kim K.M., Lee H.C., Chung Y., Lee Y.S., Yoo W., Kim S. Increased risk of adefovir resistance in patients with lamivudine-resistant chronic hepatitis B after 48 weeks of adefovir dipivoxil monotherapy. Hepatology. 2006;43:1385–1391. doi: 10.1002/hep.21189. - DOI - PubMed
    1. Sarin S.K., Kumar M., Lau G.K., Abbas Z., Chan H.L.Y., Chen C.J., Chen D.S., Chen H.L., Chen P.J., Chien R.N., et al. Asian-Pacific clinical practice guidelines on the management of hepatitis B: A 2015 update. Hepatol. Int. 2016;10:1–98. - PMC - PubMed

Publication types

MeSH terms

LinkOut - more resources