. 2024 Nov 13;16(11):1773.
doi: 10.3390/v16111773.

The Transcriptional Program of Staphylococcus aureus Phage K Is Affected by a Host rpoC Mutation That Confers Phage K Resistance

Affiliations

The Transcriptional Program of Staphylococcus aureus Phage K Is Affected by a Host rpoC Mutation That Confers Phage K Resistance

Rohit Kongari et al. Viruses. .

Abstract

To better understand host-phage interactions and the genetic bases of phage resistance in a model system relevant to potential phage therapy, we isolated several spontaneous mutants of the USA300 S. aureus clinical isolate NRS384 that were resistant to phage K. Six of these had a single missense mutation in the host rpoC gene, which encodes the RNA polymerase β' subunit. To examine the hypothesis that mutations in the host RNA polymerase affect the transcription of phage genes, we performed RNA-seq analysis on total RNA samples collected from NRS384 wild-type (WT) and rpoCG17D mutant cultures infected with phage K, at different timepoints after infection. Infection of the WT host led to a steady increase of phage transcription relative to the host. Our analysis allowed us to define 53 transcriptional units and to categorize genes based on their temporal expression patterns. Predicted promoter sequences defined by conserved -35, -10, and, in some cases, extended -10 elements, were found upstream of early and middle genes. However, in many cases, sequences upstream of late genes did not contain clear, complete, canonical promoter sequences, suggesting that factors in addition to host RNA polymerase are required for their expression. Infection of the rpoCG17D mutant host led to a transcriptional pattern that was similar to that of the WT at early timepoints. However, beginning at 20 min after infection, transcription of late genes (such as phage structural genes and host lysis genes) was severely reduced. Our data indicate that the rpoCG17D mutation prevents the expression of phage late genes, resulting in a failed infection cycle for phage K. In addition to illuminating the global transcriptional landscape of phage K throughout the infection cycle, this study will inform our investigations into the basis of phage K's control of its transcriptional program as well as mechanisms of phage resistance.

Keywords: RNA-sequencing; bacteriophages; methicillin resistant Staphylococcus aureus; phage resistance; phage transcriptomics.


Conflict of interest statement

The authors declare no conflicts of interest.

Figures
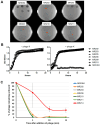
Figure 1
Figure 1
Initial characterization of the NRS384 rpoC mutants resistant to phage K. (A) Plaquing phenotype of phage K on NRS384WT host and resistant mutants. Serial dilutions of phage K stock were spotted onto bacterial agar overlays of the wild-type and different mutant hosts and incubated overnight at 30 °C. (B) Growth curves of NRS384WT host and different rpoC mutants in the absence (left) and presence (right) of phage K at 30 °C. (C) Adsorption efficiency of phage K to different rpoC hosts at 30 °C, shown as the percentage of unbound phage remaining in the supernatant.
Figure 2
Figure 2
Spatial representation of rpoC mutations that confer phage K resistance. (A) Three-dimensional structure of RNA polymerase homolog from E. coli modeled together with fork junction DNA (orange). The alpha, beta, beta’, omega, and sigma subunits of RNAP are differently colored and labeled. Mutated amino acid residues are shown in red (adapted from PDB structure ID: 1L9Z [55]). (B) Alignment of rpoC b’ subunit sequences (first 300 amino acids) from S. aureus NRS384 and E. coli MG1655 showing conserved regions in the N-terminal domain (amino acids are highlighted according to the Clustal color scheme). Positions of residues mutated in the phage-resistant rpoC mutants are indicated by red asterisks above the identity bars.
Figure 3
Figure 3
MultiQC and principal component analysis of RNA-seq reads from samples of phage K infection of WT and rpoC host. (A) Distribution of percentage of reads, calculated as an average of four replicates, mapping to the phage and host at different infection timepoints. The left panel shows phage (turquoise) vs. bacterial (yellow) reads in the NRS384WT host infection. The right panel shows phage (dark blue) vs. bacterial (red) reads in the phage-resistant rpoCG17D host infection. (B) Principal component analysis of total reads mapping to the phage genome from phage K infections of NRS384WT (triangles) and rpoCG17D (diamonds) hosts collected at different timepoints (colors indicated in the legend). Each plotted point refers to a replicate, and the replicates for each timepoint are grouped within an ellipse (solid line for NRS384WT and dotted line for rpoCG17D).
Figure 4
Figure 4
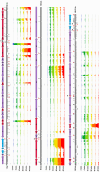
The global transcriptional profile of phage K at different timepoints after infecting NRS384WT host. Visualization of reads mapping to the phage genome at different timepoints from a representative sample of the four replicates. The panels are arranged from top to bottom in order of increasing time after infection (2 min, dark blue; 5 min, dark green; 10 min, light green; 20 min, yellow; 30 min, orange; 40 min, red). The upper limit for the Y-axis in each panel is 106 counts. The protein-coding genes and tRNA genes are shown in grey and pink, respectively, and the long terminal repeats are indicated by the bars with diagonal shading. Predicted promoter and terminator locations are denoted by arrows and red circles, respectively. The proposed transcriptional units are indicated by thick arrow bars (light blue, early; purple, middle; maroon, late).
Figure 5
Figure 5
The promoters driving different stages of gene expression in phage K. WebLogo consensus sequences for early, middle, and late promoters in phage K, grouped by spacer length. Numbers indicate the position of the bases in the promoter element as annotated in Table S1, and the height of the bases indicates the degree of conservation at that particular position.
Figure 6
Figure 6
Differential expression analysis of phage K genes during infection of WT host. (A) Heatmap depicting log2-fold change between consecutive timepoints (2 min vs. 0 min, 5 min vs. 2 min, and so on until 40 min vs. 30 min) for all phage K genes (blue, increase; red, decrease) following infection of NRS384. Hierarchical clustering of genes based on temporal pattern of gene expression is shown on the Y-axis. The four replicate samples for each timepoint post-infection are labeled on the X-axis. (B) Co-expression clusters as identified by the Clust package. The Y-axis represents the z-scores calculated by Clust using normalized TPM data for each gene, accounting for all four replicate samples, and the time after infection is represented on the X-axis. Each line corresponds to the expression pattern of one gene belonging to the cluster.
Figure 7
Figure 7
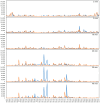
Effect of rpoCG17D mutation on phage K transcriptional program. Visualization of differences in global transcription of phage K in rpoCG17D (orange) compared to NRS384WT (blue) at 10, 20, 30, and 40 min after infection. Only normalized count data of reads mapping to the annotated features (in the order they are structured in the phage genome) are shown.
Figure 8
Figure 8
Differential expression analysis of phage K genes in rpoCG17D mutant compared to NRS384WT host. (A) Volcano plots showing the extent of differential expression of phage K genes in rpoCG17D compared to NRS384WT. Log2-fold change is shown on the X-axis, and the log10-transformed adjusted p-value is shown on the Y-axis. The dots in the orange shaded region represent the genes showing significant (log2-fold change > 1) decreases in expression, whereas those in the blue shaded region show increases. (B) Number of genes differentially expressed (showing a log2-fold change of at least +1 or −1) during phage K infection of the rpoCG17D mutant at different timepoints, when compared to WT infection. (C) Comparison of normalized counts for 12 selected genes from the C4 cluster at different timepoints during the course of infection of NRS384WT (left) and rpoCG17D (right). Bars for the different genes are color-coded as indicated and include gp116 (head decoration protein), gp159 (tail chaperone), gp160 (tail tape measure protein), gp165 (tail tube protein), gp166 (tail sheath protein), gp167 (hypothetical protein), gp168 (tail completion protein), gp173 (major capsid protein), gp175 (prohead protease), gp188 (putative membrane protein), gp193 (holin), and gp195 (endolysin).

Similar articles

References

    1. Tong S.Y.C., Davis J.S., Eichenberger E., Holland T.L., Fowler V.G., Jr. Staphylococcus aureus infections: Epidemiology, pathophysiology, clinical manifestations, and management. Clin. Microbiol. Rev. 2015;28:603–661. doi: 10.1128/CMR.00134-14. - DOI - PMC - PubMed
    1. Wertheim H.F.L., Melles D.C., Vos M.C., van Leeuwen W., van Belkum A., Verbrugh H.A., Nouwen J.L. The role of nasal carriage in Staphylococcus aureus infections. Lancet Infect. Dis. 2005;5:751–762. doi: 10.1016/S1473-3099(05)70295-4. - DOI - PubMed
    1. Gorwitz R.J., Kruszon-Moran D., McAllister S.K., McQuillan G., McDougal L.K., Fosheim G.E., Jensen B.J., Killgore G., Tenover F.C., Kuehnert M.J. Changes in the Prevalence of Nasal Colonization with Staphylococcus aureus in the United States, 2001–2004. J. Infect. Dis. 2008;197:1226–1234. doi: 10.1086/533494. - DOI - PubMed
    1. Chambers H.F., Deleo F.R. Waves of resistance: Staphylococcus aureus in the antibiotic era. Nat. Reviews. Microbiol. 2009;7:629–641. doi: 10.1038/nrmicro2200. - DOI - PMC - PubMed
    1. Francis J.S., Doherty M.C., Lopatin U., Johnston C.P., Sinha G., Ross T., Cai M., Hansel N.N., Perl T., Ticehurst J.R., et al. Severe Community-Onset Pneumonia in Healthy Adults Caused by Methicillin-Resistant Staphylococcus aureus Carrying the Panton-Valentine Leukocidin Genes. Clin. Infect. Dis. 2005;40:100–107. doi: 10.1086/427148. - DOI - PubMed

Publication types

MeSH terms

Substances

Associated data

LinkOut - more resources