. 2025 Jan 8;255(0):222-243.
doi: 10.1039/d4fd00088a.

Organic NMR crystallography: enabling progress for applications to pharmaceuticals and plant cell walls

Affiliations

Organic NMR crystallography: enabling progress for applications to pharmaceuticals and plant cell walls

Zainab Rehman et al. Faraday Discuss. .

Abstract

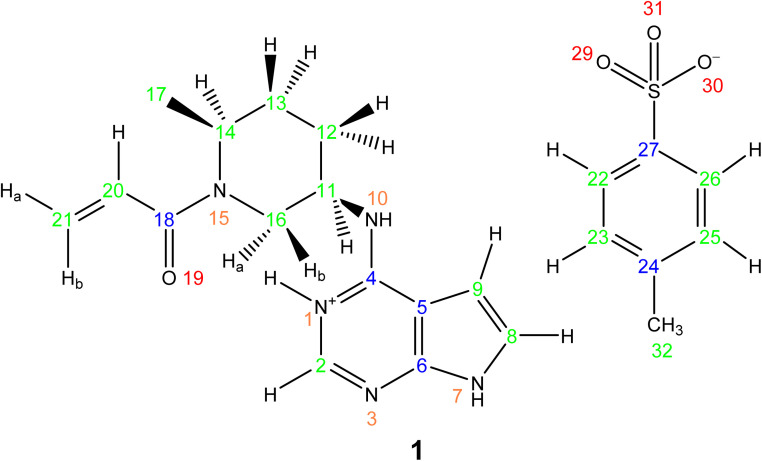
The application of NMR crystallography to organic molecules is exemplified by two case studies. For the tosylate salt of the active pharmaceutical ingredient, Ritlectinib, solid-state NMR spectra are presented at a 1H Larmor frequency of 1 GHz and a magic-angle spinning (MAS) frequency of 60 kHz. Specifically, 14N-1H heteronuclear multiple-quantum coherence (HMQC) and 1H-1H double-quantum (DQ) single-quantum (SQ) correlation experiments are powerful probes of hydrogen bonding interactions. A full assignment of the 1H, 13C and 14N/15N chemical shifts is achieved using also 1H-13C cross polarization (CP) HETCOR spectra together with gauge-including projector augmented wave (GIPAW) DFT calculation for the geometry-optimised X-ray diffraction crystal structure that is reported here (CCDC 2352028). In addition, GIPAW calculations are presented for the 13C chemical shifts in the two polymorphs of cellulose for which diffraction structures are available. For both case studies, a focus is on the discrepancy between experiment and GIPAW calculation.


Conflict of interest statement

Some of the authors are employees of Pfizer, and compound 1 is a Pfizer pharmaceutical.

Figures

Scheme 1
Scheme 1
Fig. 1
Fig. 1. (a) A 14N–1H (600 MHz) HMQC MAS (60 kHz) NMR spectrum with skyline projections of 1 recorded with 16 rotor periods of phase-inverted R3 recoupling, τRCPL = 267.2 μs. (b) Comparison to a 1D 1H (500 MHz)–15N CP (3.5 ms) MAS (12.5 kHz) NMR spectrum of 1 acquired with 10 240 co-added transients. The arrows indicate the difference between the 14N shift and the 15N chemical shifts for N1, N7 and N10.
Fig. 2
Fig. 2. Intermolecular NH⋯O hydrogen bonds in the DFT (CASTEP) geometry optimised crystal structure of 1 (CCDC 2352028) between the oxygen atoms of the tosylate salt and the three NH protons of the API free base (see Table 2 for the hydrogen bond distances and angles).
Fig. 3
Fig. 3. A 1H (1 GHz) DQ–SQ 2D MAS (60 kHz) NMR spectrum of 1 with skyline projections recorded with one rotor period of BaBa recoupling. The base contour level is at 4% of the maximum peak height.
Fig. 4
Fig. 4. (a) A 1D 1H (600 MHz)–13C CP (2 ms) MAS (12.5 kHz) NMR spectrum (top) of 1 acquired with 2048 co-added transients. The asterisks denote spinning sidebands. The stick spectrum (bottom) represents the GIPAW calculated 13C chemical shifts for the DFT (CASTEP) geometry-optimised structure of 1 (CCDC 2352028, see Table 4). (b) and (c) Two-dimensional 1H (1 GHz)–13C CP (500 μs) HETCOR MAS (60 kHz) NMR spectra with skyline projections for the aromatic and aliphatic regions, respectively. Here, the low-power 13C irradiation during CP was at an irradiation frequency of (b) 120 ppm and (c) 50 ppm. The black crosses in (b) and (c) represent the GIPAW calculated chemical shifts for the directly bonded CH connectivities up to 1.1 Å. The base contour level is at 17% and 14% of the maximum peak height for (b) and (c), respectively.
Fig. 5
Fig. 5. 2D MAS (60 kHz) NMR spectra with skyline projections of 1 recorded at 1 GHz. Top: 1H–13C CP HETCOR spectra for the high (left) and low (right) ppm regions repeated from Fig. 4b and c, respectively. Bottom: Corresponding regions of the 1H–1H DQ–SQ spectrum repeated from Fig. 3. Note that the 1H–13C CP HETCOR spectra have been rotated through 90° so as to achieve the alignment of the 1H SQ axis as horizontal for both sets of spectra.

Similar articles

Cited by

References

    1. Pickard C. J. Mauri F. Phys. Rev. B: Condens. Matter Mater. Phys. 2001;63:245101. doi: 10.1103/PhysRevB.63.245101. - DOI
    1. Yates J. R. Pickard C. J. Mauri F. Phys. Rev. B: Condens. Matter Mater. Phys. 2007;76:024401. doi: 10.1103/PhysRevB.76.024401. - DOI
    1. Bonhomme C. Gervais C. Babonneau F. Coelho C. Pourpoint F. Azais T. Ashbrook S. E. Griffin J. M. Yates J. R. Mauri F. Pickard C. J. Chem. Rev. 2012;112:5733. doi: 10.1021/cr300108a. - DOI - PubMed
    1. Rehman Z. Franks W. T. Nguyen B. Schmidt H. F. Scrivens G. Brown S. P. J. Pharm. Sci. 2023;112:1915. doi: 10.1016/j.xphs.2023.02.022. - DOI - PubMed
    1. Simmons T. J. Mortimer J. C. Bernardinelli O. D. Poppler A. C. Brown S. P. Deazevedo E. R. Dupree R. Dupree P. Nat. Commun. 2016;7:13902. doi: 10.1038/ncomms13902. - DOI - PMC - PubMed

MeSH terms

LinkOut - more resources