. 2024 Nov 26:7:0539.
doi: 10.34133/research.0539. eCollection 2024.

STAT2/SLC27A3/PINK1-Mediated Mitophagy Remodeling Lipid Metabolism Contributes to Pazopanib Resistance in Clear Cell Renal Cell Carcinoma

Affiliations

STAT2/SLC27A3/PINK1-Mediated Mitophagy Remodeling Lipid Metabolism Contributes to Pazopanib Resistance in Clear Cell Renal Cell Carcinoma

Dingheng Lu et al. Research (Wash D C). .

Abstract

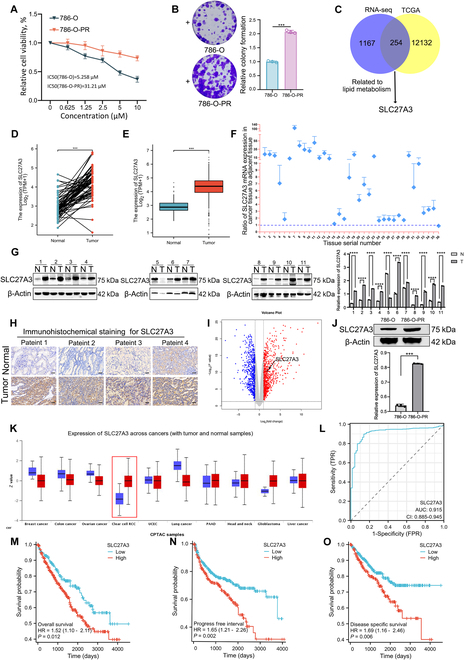
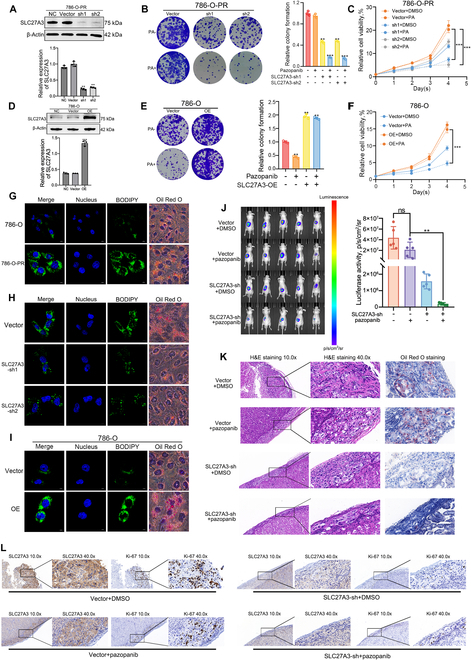
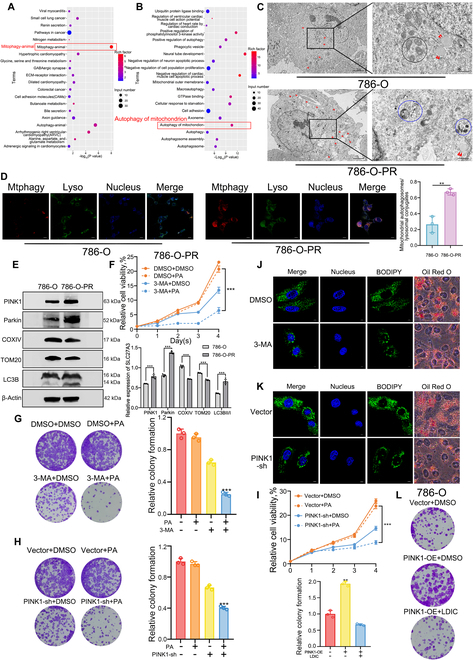
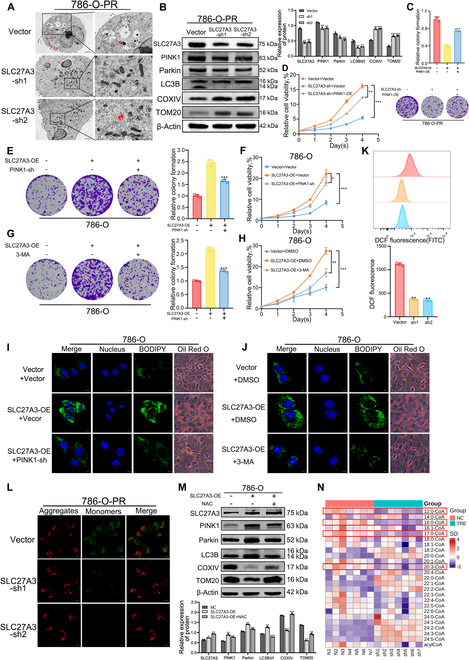
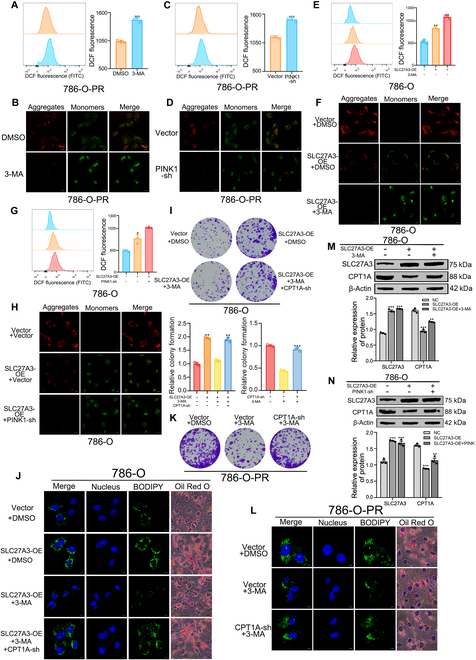
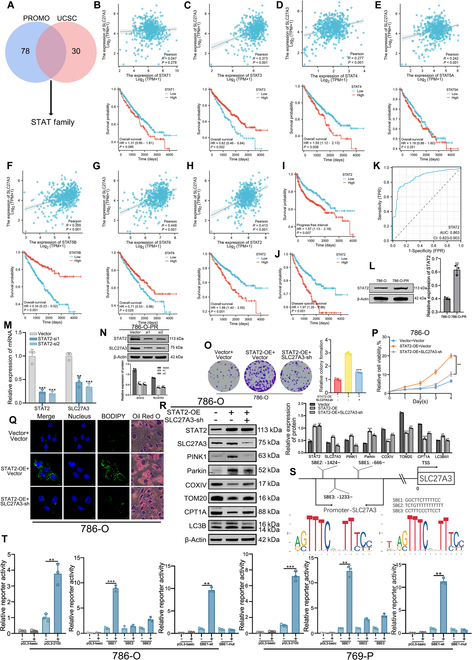
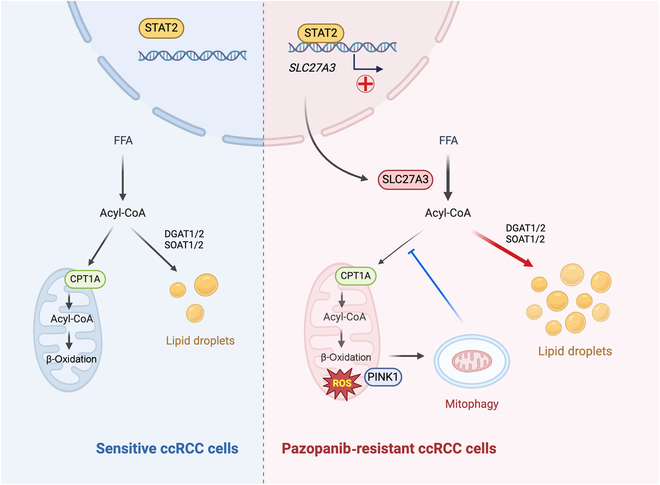
Background: Clear cell renal cell carcinoma (ccRCC) is a prevalent malignant tumor of the urinary system. While tyrosine kinase inhibitors (TKIs) are currently the first-line treatments for advanced/metastatic ccRCC, patients often develop resistance after TKI therapy. Lipid metabolic reprogramming, a hallmark of tumor progression, contributes to acquired drug resistance in various malignant tumors. Mitophagy, a process that maintains mitochondrial homeostasis, aids tumor cells in adapting to microenvironmental changes and consequently developing drug resistance. Solute carrier family 27 member 3 (SLC27A3), highly expressed in lipid-rich tumors like ccRCC, has been associated with poor prognosis. However, the impact of SLC27A3 and the transcription factor complex containing STAT2 on lipid metabolic reprogramming, mitophagy in ccRCC, and their role in TKI resistance remain unexplored. Methods: 786-O to pazopanib resistance was induced by gradient increase of concentration, and the genes related to lipid metabolism were screened by RNA sequencing. Bioinformatics was used to analyze the differential expression of SLC27A3 and its effect on patient prognosis, and to predict the activated pathway in pazopanib-resistant cells. Lipid droplets (LDs) were detected by Red Oil O and BODIPY probe. Micro-targeted lipidomic of acyl-coenzyme A (CoA) and lipid metabolomics were performed to screen potential metabolites of SLC27A3. The differential expression of SLC27A3 was detected in clinical samples. The differential expression of SLC27A3 and its effect on drug resistance of ccRCC tumor were detected in vitro and in vivo. Mitophagy was detected by electron microscopy, Mtphagy probe, and Western blot. The mitochondrial membrane potential (MMP) and reactive oxygen species (ROS) levels were detected by JC-1 and DCF probes. The binding site of the transcription factor complex to the SLC27A3 promoter was detected by dual-luciferase reporter gene assay. Results: SLC27A3, highly expressed in lipid-rich tumors such as ccRCC and glioblastoma, predicts poor prognosis. SLC27A3 expression level also increased in pazopanib-resistant 786-O cells (786-O-PR) with more LD accumulation compared to parental cells. Gene Ontology (GO) and Kyoto Encyclopedia of Genes and Genomes (KEGG) pathway analysis from RNA sequencing showed that PINK1/Parkin-mediated mitophagy pathway was enriched in 786-O-PR. Knockdown of SLC27A3 markedly suppressed LD accumulation and mitophagy, and overcame pazopanib resistance in vitro and in vivo. Moreover, SLC27A3 functions as an acyl-CoA ligase catalyzing the formation of acyl-CoA, which refers to fatty acid oxidation accompanied by ROS production and synthesis of lipid. Overproduced acyl-CoA oxidation in mitochondria resulted in MMP decrease and amounts of ROS production, subsequently triggering PINK1/Parkin-mediated mitophagy. Moreover, mitophagy inhibition led to more ROS accumulation and cell death, indicating that mitophagy can keep ROS at an appropriate level by negative feedback. Mitophagy, simultaneously, prevented fatty acid oxidation in mitochondria by consuming CPT1A, forcing synthesis of triglycerides and cholesterol esters stored in LDs by transforming acyl-CoA, to support ccRCC progression. Besides, we found that STAT2 expression was positively correlated to SLC27A3. Transcriptional factor complex containing STAT2 could bind to the promoter of SLC27A3 mRNA to promote SLC27A3 transcription proved by dual-luciferase reporter assay, which also regulated LD metabolism and activated mitophagy during pazopanib resistance. Conclusion: SLC27A3 is up-regulated in pazopanib-resistant ccRCC and predicts poor prognosis. High expression of SLC27A3 produces excessive metabolites of various long-chain fatty acyl-CoA (12:0-, 16:0-, 17:0-, 20:3-CoA) to enter mitochondria for β-oxidation and produce amounts of ROS activating mitophagy. Subsequent mitophagy/ROS negative feedback controls ROS homeostasis and consumes CPT1A protein within mitochondria to suppress fatty acid β-oxidation, forcing acyl-CoA storage in LDs, mediating pazopanib resistance in ccRCC. Furthermore, STAT2 was identified as a core component of a potential upstream transcriptional factor complex for SLC27A3. Our findings shed new light on the underlying mechanism of SLC27A3 in ccRCC TKI resistance, which may provide a novel therapeutic target for the management of ccRCC.


Conflict of interest statement

Competing interests: The authors declare that they have no competing interests.

Figures

Fig. 1.
Fig. 1.
SLC27A3 up-regulation in the newly established ccRCC cell lines and its association with prognosis. (A) IC50 values of 786-O and 786-O-PR cells. (B) Proliferation ability of 786-O and 786-O-PR cells was detected by colony formation assay. (C) Overlap TCGA-KIRC up-regulated gene data and RNA-sequencing results from 786-O and 786-O-PR and select SLC27A3. (D and E) SLC27A3 was highly expressed in tumor tissues according to the TCGA-KIRC database. (F) SLC27A3 mRNA levels in 36 ccRCC tissues and adjacent normal tissues (the control group: the mRNA level of normal tissues). (G) Western blot experiments for SLC27A3 protein level were performed in tumor and adjacent tissues collected from 11 patients with ccRCC (N, normal; T, tumor). (H) The expression of SLC27A3 was identified by IHC in normal and tumor tissues from collected samples in the hospital. (I) RNA-sequencing results showed that SLC27A3 was up-regulated in 786-O-PR cells compared with parental cells. (J) Western blot experiment results showed that SLC27A3 was up-regulated in 786-O-PR cells compared with parental ones. (K) Pan-cancer analysis revealed that SLC27A3 was significantly overexpressed in lipid-rich tumors. (L) ROC curve analysis showed that SLC27A3 expression is specific in ccRCC. (M to O) OS, PFI, and DSS were analyzed according to high or low expression of SLC27A3, and the log-rank t test was used (*P < 0.05, **P < 0.01, ***P < 0.001).
Fig. 2.
Fig. 2.
SLC27A3 mediates TKI resistance in ccRCC by regulating LDs. (A to C) Protein expression levels, relative colony formation, and relative cell viabilities detected by Western blot, colony formation assay, and CCK-8 assay in 786-O-PR cells after transfection with sh1-SLC27A3 or sh2-SLC27A3 plasmids. (D to F) Protein expression levels, relative colony formation, and relative cell viabilities detected by Western blot, colony formation assay, and CCK-8 assay in 786-O cells after transfection with SLC27A3-OE plasmids. (G) LD in 786-O and 786-O-PR cells detected by BODIPY staining and Oil Red O staining. (H) LD in the SLC27A3-sh1 and SLC27A3-sh2 transfection groups and the control group detected by BODIPY and Oil Red O staining. (I) LD of 786-O in the SLC27A3-OE transfection groups and the control group detected by BODIPY and Oil Red O staining. (J) Representative image and fluorescence intensity of renal orthotopic tumors in nude mice (n = 5 per group). (K) Hematoxylin and eosin (H&E) staining, along with Oil Red O staining, was utilized to assess both the quantity and dimensions of tumor formations in vivo. (L) IHC staining of SLC27A3 and Ki-67 was utilized to assess tumor growth in vivo.
Fig. 3.
Fig. 3.
Mitophagy can mediate TKI resistance in ccRCC by regulating LDs. (A and B) KEGG and GO enrichment analysis between 786-O-PR versus 786-O cells. (C) TEM manifested that 786-O-PR cells showed more LDs and mitophagy phenomenon than 786-O cells (original magnification, ×1,200 and ×5,000, respectively). Red arrow, LD; blue circle, mitophagy; black circle, normal mitochondria. (D) More mitophagy phenomena and lysosome activation were detected by Mtphagy and Lyso probes in 786-O-PR cells. (E) Expression levels of mitophagy-related proteins between 786-O and 786-O-PR cells. (F) Relative cell viabilities of 786-O-PR treated with 3-MA were detected by CCK-8. (G and H) Proliferation ability of 786-O-PR treated with 3-MA or stably transfected with PINK1-sh plasmids or vectors was detected by colony formation assay. (I) Relative cell viabilities of 786-O-PR stably transfected with PINK1-sh plasmids were detected by CCK-8. (J and K) LD in the 3-MA treatment group or the stable PINK1-sh transfection group as well as the control groups detected by BODIPY staining and Oil Red O staining. (L) Proliferation ability of 786-O stably transfected with PINK1-OE plasmids or vectors or treated with LDIC was detected by colony formation assay.
Fig. 4.
Fig. 4.
SLC27A3 mediates mitophagy by regulating ROS levels, affecting LD formation and TKI resistance in ccRCC. (A) TEM analysis revealed a reduction in mitophagy in 786-O-PR cells following SLC27A3 knockdown (original magnification, ×1,200 and ×5,000, respectively). Red arrow, LD. (B) Expression levels of mitophagy-related proteins between 786-O-PR and 786-O-PR cells with SLC27A3 knocked down. (C and D) Proliferation ability of 786-O-PR cells stably transfected with PINK1-OE plasmids, or SLC27A3-sh was detected by colony formation and CCK-8 assays. (E and F) Proliferation ability of 786-O cells stably transfected with SLC27A3-OE plasmids or PINK1-sh was detected by colony formation and CCK-8 assays. (G and H) Proliferation ability of 786-O cells stably transfected with SLC27A3-OE plasmids or added with 3-MA was detected by colony formation and CCK-8 assays. (I) LD in the SLC27A3-OE treatment group, SLC27A3-OE cotreatment group with PINK1-sh, and the control group detected by BODIPY and Oil Red O staining. (J) LDs in the SLC27A3-OE treatment group, SLC27A3-OE cotreatment group with 3-MA, and the control group detected by BODIPY and Oil Red O staining. (K) The DCF fluorescence level of ROS was detected by flow cytometry. (L) MMP levels were measured by JC-1 fluorescence probe. (M) Expression level of mitophagy-related proteins in 786-O cells tested by Western blot. (N) Lipomic analysis of long-chain fatty acyl-CoA between SLC27A3 knockdown and control group in pazopanib-resistant cells.
Fig. 5.
Fig. 5.
Mitophagy exerts a negative regulatory influence on CPT1A and ROS levels, consequently modulating the process of lipid biosynthesis. (A to D) ROS and MMP levels detected by flow cytometry and JC-1 fluorescence probe of the 786-O-PR cells added with 3-MA or PINK1-sh and the control groups. (E to H) ROS and MMP levels detected by flow cytometry and JC-1 fluorescence probe of the 786-O cells transfected with SLC27A3-OE and added with 3-MA or PINK1-sh and the control groups. (I) Effects of SLC27A3-OE, 3-MA, and CPT1A-sh on relative colony formation of 786-O cells. (J) Effects of SLC27A3-OE, 3-MA, and CPT1A-sh on LD synthesis ability of 786-O cells detected by BODIPY and Oil Red O staining. (K) Effects of 3-MA and CPT1A-sh on relative colony formation of 786-O-PR cells. (L) Effects of 3-MA and CPT1A-sh on LD synthesis ability of 786-O-PR cells detected by BODIPY and Oil Red O staining. (M and N) Expression levels of SLC27A3 and CPT1A detected by Western blot experiments in 786-O transfected with SLC27A3-OE and added with 3-MA or PINK1-sh.
Fig. 6.
Fig. 6.
The transcription factor STAT2 influences the expression of SLC27A3 and downstream biological behaviors. (A) STAT family was selected from the PROMO and UCSC databases. (B to H) Pearson correlation analysis of STAT family and SLC27A3 expression levels and clinical OS curves of STAT family members. (I to K) PFI analysis, DSS analysis, and ROC curve of STAT2 in KIRC-TCGA database. (L) Protein expression levels of STAT2 in both 786-O and 786-O-PR cells detected by Western blot experiment. (M) The mRNA expression level of SLC27A3 decreased after knocking down STAT2. (N) The protein expression level of SLC27A3 decreased after knocking down STAT2. (O and P) Proliferation ability of 786-O cells stably transfected with STAT2-OE plasmids and SLC27A3-sh was detected by colony formation and CCK-8 assays. (Q) LD in the STAT2-OE treatment group, STAT2-OE cotreatment group with SLC27A3-sh, and the control group of 786-O cells detected by BODIPY staining and Oil Red O staining. (R) Expression levels of mitophagy-related proteins in 786-O cells detected by Western blot. (S) Transcription factor binding sites were confirmed and analyzed in the JASPAR database, screening the most suitable transcriptional factor binding site. (T) Dual-luciferase reporter assays on SBE1, SBE2, and SBE3 binding site of the SLC27A3 promoter in 786-O and 769-P cell lines.
Fig. 7.
Fig. 7.
Schematic diagram.

Similar articles

Cited by

References

    1. Zhang X, Zhang G, Xu L, Bai X, Zhang J, Chen L, Lu X, Yu S, Jin Z, Sun H. Prediction of World Health Organization/International Society of Urological Pathology (WHO/ISUP) pathological grading of clear cell renal cell carcinoma by dual-layer spectral CT. Acad Radiol. 2023;30(10):2321–2328. - PubMed
    1. Huang B, Ren J, Ma Q, Yang F, Pan X, Zhang Y, Liu Y, Wang C, Zhang D, Wei L, et al. . A novel peptide PDHK1-241aa encoded by circPDHK1 promotes ccRCC progression via interacting with PPP1CA to inhibit AKT dephosphorylation and activate the AKT-mTOR signaling pathway. Mol Cancer. 2024;23(1):34. - PMC - PubMed
    1. Hu J, Wang SG, Hou Y, Chen Z, Liu L, Li R, Li N, Zhou L, Yang Y, Wang L, et al. . Multi-omic profiling of clear cell renal cell carcinoma identifies metabolic reprogramming associated with disease progression. Nat Genet. 2024;53(3):442–457. - PMC - PubMed
    1. Rosellini M, Marchetti A, Mollica V, Rizzo A, Santoni M, Massari F. Prognostic and predictive biomarkers for immunotherapy in advanced renal cell carcinoma. Nat Rev Urol. 2023;20(3):133–157. - PubMed
    1. Bian X, Liu R, Meng Y, Xing D, Xu D, Lu Z. Lipid metabolism and cancer. J Exp Med. 2021;218(1):e20201606. - PMC - PubMed

LinkOut - more resources