. 2024 Nov 25;10(6):e200209.
doi: 10.1212/NXG.0000000000200209. eCollection 2024 Dec.

Clinical Features, Biochemistry, Imaging, and Treatment Response in a Single-Center Cohort With Coenzyme Q10 Biosynthesis Disorders

Affiliations

Clinical Features, Biochemistry, Imaging, and Treatment Response in a Single-Center Cohort With Coenzyme Q10 Biosynthesis Disorders

Azizia Wahedi et al. Neurol Genet. .

Abstract

Background and objectives: Disorders of coenzyme Q10 (CoQ10) biosynthesis comprise a group of 11 clinically and genetically heterogeneous rare primary mitochondrial diseases. We sought to delineate clinical, biochemical, and neuroimaging features of these disorders, together with outcomes after oral CoQ10 supplementation and the utility of peripheral blood mononuclear cell (PBMNC) CoQ10 levels in monitoring therapy.

Methods: This was a retrospective cohort study, registered as an audit at a specialist pediatric hospital (Registration Number: 3318) of 14 patients with genetically confirmed CoQ10 biosynthesis deficiency, including 13 previously unreported cases.

Results: We show that oral doses of CoQ10 up to 70 mg/kg/d were needed to ameliorate neurologic features. Additional idebenone was required to control seizures in some cases, and 3 children with neonatal-onset neurologic disease died in early childhood despite receiving high-dose oral CoQ10 from birth. We also demonstrate that early diagnosis and treatment of CoQ10 deficiency with oral supplementation (30 mg/kg/d) can reverse renal manifestations and can completely prevent kidney disease over 10 years of follow-up. PBMNC CoQ10 levels increased after oral CoQ10 supplementation, demonstrating absorption of exogenous CoQ10 into the bloodstream.

Discussion: An early genome-wide diagnostic approach is needed for expeditious diagnosis of CoQ10 biosynthesis disorder because our study demonstrates that there are no pathognomonic blood, muscle, or imaging biomarkers of these diseases. Our findings indicate that earlier diagnosis and treatment with high-dose CoQ10 is key in halting progression of kidney disease or preventing it altogether. This study uses serial PBMNC CoQ10 levels to monitor therapy. Patients with genetically confirmed CoQ10 biosynthesis disorder should receive high-dose oral CoQ10 as soon as possible after presentation, regardless of genetic cause, to prevent disease progression, but parents of children with neonatal or infantile neurologic presentations should be counseled about the poor prognosis.


Conflict of interest statement

The authors report no relevant disclosures. Go to Neurology.org/NG for full disclosures.

Figures

Figure 1
Figure 1. Scheme of CoQ10 Biosynthesis
Components of the CoQ10 biosynthesis complex and enzymes known to be involved are indicated. Regulatory enzymes such as COQ8 and COQ9 are indicated at the steps in which they are involved. Enzymes outlined in a black box indicate those in which variant(s) in the COQ gene(s) are found in our cohort. 4HB = 4-hydroxybenzoate; DPHB = decaprenyl hydroxybenzoic acid; DHHB = 3-hexaprenyl-4,5-dihydroxybenzoic acid; DPVA = decaprenyl-vanillic acid; DDMQ10H2 = demethyl-demethoxy-hydroquinone; DDMQ10 = demethoxy-demethyl-coenzyme Q10; DMQ10 = demethoxy-coenzyme Q10; DMeQ10 = demethyl-coenzyme Q10.
Figure 2
Figure 2. Frequency of Clinical Features for Each COQ Gene Involved in Our Cohort of Patients With Primary CoQ10 Deficiency
In this heatmap, colors indicate the frequency of each symptom in our cohort normalized to the number of patients with variants in 1 of the 6 genes. The most prevalent symptom (deep red) was seizures, observed in 100% of the patients with pathogenic variants in COQ4 and COQ9. Seizures were observed with all gene defects except COQ8A.
Figure 3
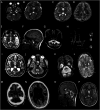
Figure 3. Representative Brain Images of Selected Patients Selected Patients From Our Cohort
MRI images for patient 7 (COQ4) at 2 years (A, B) and at 4 years (C, D) show dentate hilus hyperintensity (arrow in A) and thalamic laminar hyperintensity (arrow in C) occipital volume loss and gliosis as well as deep parietal white matter hyperintensity (arrows in D). MRI images for patient 4 (COQ4) at 14 years show pronounced cerebral volume loss, small thalamus with laminar hyperintensity (arrows in E), and cerebellar atrophy and parenchymal gliosis with inferior predominance (arrows in F, G). MR spectroscopy for patient 1 (COQ2) at 26 days shows intermediate TE showing large inverted lactate peak at 1.3 ppm (arrow in H). MRI images for patient 8 at 9 years shows diffuse cerebral atrophy, small thalamus (arrows in I), as well as diffuse cerebellar atrophy (arrow in J). MRI images for patient 13 (COQ9) at 4 weeks show simplified gyral pattern, poor operculization, small thalami (white arrows in L), and cystic foci along striatum (black arrow in L). CT of the brain for patient 12 (COQ9) at 12 months shows pronounced cerebellar and cerebral atrophy (arrows in M, N) with ex vacuo ventricular dilatation. MRI of the brain for patient 9 (COQ8A) at 14 years shows mild diffuse cerebellar atrophy (arrow in O) and normal supratentorial appearances (P).
Figure 4
Figure 4. Serial Peripheral Blood Mononuclear Cell CoQ10 Levels in 5 Patients
(A) Patient 2; (B) patient 7; (C) patient 13; (D) patient 10; (E) patient 11. The horizontal blue bar indicates supplementation with oral CoQ10 and the red bar indicates idebenone supplementation. Doses are indicated on the bar. The gradient blue bar above D indicates inconsistent supplementation after initial initiation of oral CoQ10 because of noncompliance. WCCoQ10 = white cell CoQ10. Reference range: 37–133 pmol/mg.

References

    1. Stefely JA, Pagliarini DJ. Biochemistry of mitochondrial coenzyme Q biosynthesis. Trends Biochem Sci. 2017;42(10):824-843. doi:10.1016/j.tibs.2017.06.008 - DOI - PMC - PubMed
    1. Do TQ, Schultz JR, Clarke CF. Enhanced sensitivity of ubiquinone-deficient mutants of Saccharomyces cerevisiae to products of autoxidized polyunsaturated fatty acids. Proc Natl Acad Sci U S A. 1996;93(15):7534-7539. doi:10.1073/pnas.93.15.7534 - DOI - PMC - PubMed
    1. Fontaine E, Ichas F, Bernardi P. A ubiquinone-binding site regulates the mitochondrial permeability transition pore. J Biol Chem. 1998;273(40):25734-25740. doi:10.1074/jbc.273.40.25734 - DOI - PubMed
    1. Frerman FE. Acyl-CoA dehydrogenases, electron transfer flavoprotein and electron transfer flavoprotein dehydrogenase. Biochem Soc Trans. 1988;16(3):416-418. doi:10.1042/bst0160416 - DOI - PubMed
    1. Jones ME. Pyrimidine nucleotide biosynthesis in animals: genes, enzymes, and regulation of UMP biosynthesis. Annu Rev Biochem. 1980;49:253-279. doi:10.1146/annurev.bi.49.070180.001345 - DOI - PubMed

LinkOut - more resources