. 2025 Jan;12(3):e2405758.
doi: 10.1002/advs.202405758. Epub 2024 Nov 27.

Targeting the NOTCH2/ADAM10/TCF7L2 Axis-Mediated Transcriptional Regulation of Wnt Pathway Suppresses Tumor Growth and Enhances Chemosensitivity in Colorectal Cancer

Affiliations

Targeting the NOTCH2/ADAM10/TCF7L2 Axis-Mediated Transcriptional Regulation of Wnt Pathway Suppresses Tumor Growth and Enhances Chemosensitivity in Colorectal Cancer

Zhen Xiang et al. Adv Sci (Weinh). 2025 Jan.

Abstract

Wnt/β-catenin/transcription factor (TCF) transcriptional activity plays an integral role in colorectal cancer (CRC) carcinogenesis. However, to date, no drugs targeting this pathway are used in clinical practice owing to the undesirable and serious side effects. In this study, it is found that the transcriptional regulation of Wnt pathway is activated and associated with liver metastasis in CRC. Through high-throughput screening of 24 inhibitors on 12 CRC and three colorectal organoids in this organoid living biobank, adavivint is found to exhibit anti-tumor activity and low toxicity in colorectal organoids, independent of the canonical Wnt/β-catenin signaling. Mechanistically, ADAM10 is screened as a target of adavivint to specifically regulate the protein expression of NOTCH2, which mediates the transcriptional regulation of the Wnt pathway. NOTCH2 not directly interact with TCF7-like 2 (TCF7L2), a key downstream transcriptional factor of canonical Wnt/β-catenin signaling, but directly activated the transcription of TCF7L2 and Wnt target genes, such as MYC, JUN and CCND1/2. Furthermore, use of adavivint or blockage of ADAM10/NOTCH2/TCF7L2 signaling enhances the chemosensitivity of CRC cells. Overall, this study provides a promising candidate for the development of small-molecule inhibitors and reveals a potential therapeutic target for CRC.

Keywords: ADAM10; NOTCH2; TCF7L2; Wnt pathway; colorectal cancer; liver metastasis; organoid.


Conflict of interest statement

The authors declare no conflict of interest.

Figures

Figure 1
Figure 1
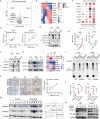
Transcriptional regulation of Wnt pathway is activated and associated with liver metastasis in CRCs. A–C) Establishment of primary CRC‐derived, liver‐metastatic CRC‐derived and colorectal organoids. Representative bright‐field microscopy images of six organoids derived from primary CRC tissues (P1‐P6), nine organoids derived from liver‐metastatic CRC tissues (LM1‐LM8) and four colorectal organoids derived from colorectal tissues (C1N,C3N,C6N,C7N), and HE staining of these organoids and corresponding tissues. D) Top 10 mutated genes in established organoids by WES sequencing. E) Correlation analysis reveals positive relationships of Wnt score between organoids and paired tumor tissues (n = 14). F) Expression of enrichment scores of Wnt pathway in colorectal organoids (n = 4), APC wild‐type CRC organoids (n = 4) and APC‐mutant CRC organoids (n = 8). G) Expression of enrichment score of Wnt pathway in APC wild‐type (n = 142) and APC‐mutant CRC tissue (n = 391) in TCGA database. H) Expression of enrichment scores of Wnt pathway in liver‐metastatic CRC tissues (n = 9), liver tissues (n = 4), normal colorectal tissues (n = 7) and primary CRC tissues (n = 7), or in colorectal organoids (n = 4), primary CRC organoids (n = 6) and liver‐metastatic CRC organoids (n = 9). I) Western blot analysis of members of classical Wnt pathway in 5 primary CRC organoids and 9 liver‐metastatic CRC organoids (Left). WNT scores and APC mutation are also displayed. Symbol “U” indicates the mutation is unknown. Heatmap indicates the relative protein levels of β‐catenin, TCF7L2, JUN, WNT3A and LEF1 (Right). J) Bright field photograph of the indicated CRC organoids cultured in medium with or without R‐spondin1. K) Heatmap shows changed enrichment scores of the indicated pathways after treated by medium minus R‐spondin1. Changed enrichment score = enrichment scores of pathways in organoids cultured medium minus R‐spondin1 – enrichment scores of pathways in organoids cultured medium plus R‐spondin1. “MT” or “WT” represents “mutation” or “wild type” respectively. WNT scores indicate Wnt pathway enrichment scores by GSVA analysis. Bar: 40×, 200µm; 200×, 50µm. All P‐values in (F, G, and H) are calculated using an unpaired two‐sided Student's t‐test, and data presented as mean ± SD. *p < 0.05, **p < 0.01, ***p < 0.001.
Figure 2
Figure 2
Usage of CRC organoid model to screen inhibitors targeting transcriptional regulation of Wnt pathway. A) Process using CRC and colorectal organoids to screening inhibitors targeting Wnt pathway. B) Heatmap shows relative viability of the 24 indicated inhibitors targeting Wnt pathway at the concentration of 1 µM. C) Heatmap shows the changed enrichment scores of KEGG pathway in LM3 organoids treated by the indicated 7 inhibitors (1 µM) for 24 hours. Changed enrichment score = enrichment scores of pathways in inhibitors‐treated organoids – enrichment scores of pathways in control organoids. D) Dose‐response curves for the 5 indicated compounds in 3 colorectal organoids, 3 primary CRC organoids and 4 liver‐metastatic CRC organoids. E) Histogram shows AUC values of the 5 indicated compounds in CRC organoids (n = 7) and colorectal organoids (n = 3). F) Representative bright‐field microscopy images of colorectal organoids and CRC organoids treated by adavivint and tegatrabetan (1 µM) for 96 hours (n = 4). Bar: 40×, 200µm.G) Enrichment scores of Wnt pathway in LM5L, LM5R and LM8 organoids treated by adavivint (0.5 µM) for 24 hours (n = 3). H) Western blot shows the protein expression of β‐catenin in cytoplasm and nucleus after treated by tegatrabetan, adavivint, teplinovivint, CWP232228, DK419, pamidronic_acid and KY1220 for 24 hours. All P‐values in (E, F and G) are calculated using an unpaired two‐sided Student's t‐test, and data presented as mean ± SD. *p < 0.05, **p < 0.01, ***p < 0.001.
Figure 3
Figure 3
Adavivint suppresses CRCs growth in vitro and in vivo. A) Correlation analysis between enrichment scores of Wnt pathway and AUC value of adavivint in CRC tissues (R = ‐0.73. P = 0.003, n = 14) and organoids (R = ‐0.74. P = 0.002, n = 15). Spearman correlation. The effect of adavivint on tumor growth B, n = 4) or body weight C, n = 4) of PDOX model established using the indicated organoids at the dose of 5mg kg−1 or 50mg kg−1. Data presented as mean ± SD, all P‐values are calculated using an unpaired two‐sided Student's t‐test. *p < 0.05. D) HE staining and IHC analysis for Ki67 and Caspase3 in representative sections from the PDOX model established using the indicated organoids. Bar: 200×, 50µm.
Figure 4
Figure 4
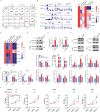
ADAM10/NOTCH2 signaling is identified as a target of adavivint to regulate Wnt pathway in CRCs. A) Volcano plot B) Heatmap shows the 6 significantly changed proteins (1.5 or 0.67, P < 0.05) after adavivint treatment for 24 hours in P9 organoids. C) Bubble diagram shows relationships between RNA levels of the six genes and Wnt pathway enrichment scores in CRCs in the indicated datasets. D) Correlation analysis of enrichment scores of Wnt pathway and NOTCH pathway in CRC tissues (R = 0.84. P < 0.001, n = 14) and organoids (R = 0.86. P < 0.001, n = 15). Spearman correlation. E) NOTCH receptors and NOTCH ligands are detected by Western blot after immunoprecipitated by anti‐ADAM10 body. F) Members of ADAM family are detected by Western blot after immunoprecipitation assay using anti‐NOTCH2 body. G) ADAM10 and NOTCH2 are detected by Western blot after treatment of adavivint for 24 hours. “ADA” indicates “adavivint”. H) Wnt pathway enrichment analysis after knockdown of ADAM10 or NOTCH2 in the indicated organoids (n = 3). I) Heatmap shows relative fold change of ADAM10, NOTCH2 and Wnt target genes by qRT‐PCR after treated by adavivint for 24 hours. J) Cell lysates are analyzed by immunoprecipitation with anti‐ADAM10 and Western blot with indicated antibodies. The black arrow indicates the band location of ADAM10 protein. K) IHC analysis for ADAM10 and NOTCH2 in representative sections from the normal tissue, primary CRC tissue, and liver‐metastatic CRC tissue (left), and correlation analysis (Spearman correlation, R = 0.86. P<0.001, n = 15) using their scores by IHC analysis in CRC tissue (right). Bar: 200×, 50µm. L) Histogram shows relative protein levels of ADAM10 and NOTCH2 in normal colorectal (n = 4), primary (n = 6) and metastatic tumor tissues (n = 6) by IHC analysis. M) ADAM10 and NOTCH2 are detected by Western blot in the indicated organoids (Left), and Corrplot shows the relationships among Wnt pathway enrichment scores, relative protein levels of ADAM10 and NOTCH2 in CRC organoids (Right). N) After knockdown of ADAM10, ADAM10 and NOTCH2 are detected by Western blot in the indicated organoids. All P‐values in (H and L) are calculated using an unpaired two‐sided Student's t‐test, and data presented as mean ± SD. *p < 0.05, **p < 0.01, ***p < 0.001.
Figure 5
Figure 5
ADAM10/NOTCH2 signaling directly activates transcription of TCF7L2 and Wnt target genes in CRC. A) Corrplot shows the relationships among AUC of adavivint, Wnt pathway enrichment score and mRNA level of transcription factor of Wnt pathway downstream in CRC organoid (n = 15, spearman correlation). B) In LM5R organoids, Cut&tag assay and sequencing analysis indicated that TCF7L2 and NOTCH2 could be enriched in promoters of Wnt target genes. The red bar indicates gene start site. C) Relative fold change of mRNA levels of the Wnt target genes after NOTCH2 or TCF7L2 knockdown using siRNAs in the indicated CRC organoids. D) Relative fold change of mRNA levels of the Wnt target genes after NOTCH2 or TCF7L2 stable knockdown in the indicated CRC organoids. E) Co‐IP assay of NOTCH2 and TCF7L2 in the indicated organoids. F) Relative fold change of mRNA levels of NOTCH2 or TCF7L2 after NOTCH2 or TCF7L2 knockdown in the indicated CRC organoids (n = 3). G) Cut&tag assay and qRT‐PCR shows that NOTCH2 directly binds to promoter of TCF7L2, which could be attenuated by ADAM10 knockdown (n = 3). H,I) Western blot shows decreased TCF7L2 after ADAM10 and NOTCH2 knockdown in the indicated CRC organoids. J) Relative mRNA levels of the Wnt target genes after NOTCH2 knockdown in CRC organoids overexpressed TCF7L2 (n = 3). K) CCK8 assay is conducted to assess proliferation ability of the indicated organoids treated by NOTCH2 siRNAs (n = 3). All P‐values in (F, G, J, and K) are calculated using an unpaired two‐sided Student's t‐test, and data presented as mean ± SD. *p < 0.05, **p < 0.01, ***p < 0.001.
Figure 6
Figure 6
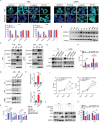
Both adavivint and blockage of ADAM10/NOTCH2/TCF7L2 signaling suppress growth of CRC organoids by decreasing expression of Wnt target genes. A) IF analysis for ADAM10, NOTCH2, β‐catenin and TCF7L2 in CRC organoids after adavivint treatment for 24 hours (n = 4). Bar: 400×, 50µm. B) Western blot analysis of ADAM10 and NOTCH2 in colorectal tissues, primary and liver‐metastatic CRC tissues. C) Western blot analysis of NOTCH2, β‐catenin, MYC and JUN in the indicated organoids after treated by adavivint (0.5 µM) for 24 hours. “ADA” indicates “adavivint”. D) Western blot analysis of TCF7L2 in the indicated organoids treated by adavivint (0.5 µM) for 24 hours and 48 hours. E) Cut&tag assay and qRT‐PCR shows that NOTCH2 binding to promoter of TCF7L2 could be attenuated by adavivint (0.5 µM) for 24 hours (n = 3). F) After treated by adavivint for 24 hours, CCK8 assay is performed to examine the proliferation ability of the indicated organoids transfected by MYC or JUN‐overexpressing plasmid (n = 4). G) Western blot analysis of MYC and JUN in the indicated organoids transfected by ADAM10, NOTCH2, and TCF7L2 siRNAs. H) In the indicated organoids transfected by ADAM10‐overexpressing plasmid for 24 hours, CCK8 assay is performed to assess the proliferation ability of the indicated organoids after transfected by MYC or JUN siRNA. I) CCK8 assay was used to examine the effect of NOTCH2 knockdown on proliferation ability of the indicated organoids overexpressing ADAM10 (n = 4). In the indicated organoids transfected by ADAM10 siRNA for 24 hours, J) Western blot analysis was used to detect MYC and JUN after transfected by MYC or JUN‐overexpressing plasmid, and K) CCK8 assay is further performed to assess the proliferation ability of the indicated organoids (n = 3). All P‐values in are calculated using an unpaired two‐sided Student's t‐test, and data presented as mean ± SD. *p < 0.05, **p < 0.01, ***p < 0.001.
Figure 7
Figure 7
Adavivint or targeting ADAM10/NOTCH2 signaling alleviates chemoresistance by suppressing expression of Wnt target genes in CRCs. A) CCK8 assay was performed to calculate the AUC of FOLFOX in the indicated organoids. “Chemo” with “Y” indicated the patient had received regimen of FOLFOX before surgery. B) Dose‐response curves for regimen of FOLFOX in established FOLFOX‐resistant CRC organoids (n = 3). C) Enrichment scores of Wnt pathway in FOLFOX‐resistant CRC organoids treated by adavivint (0.5 µM, n = 3). D) In FOLFOX‐resistant organoids, Western blot analysis is used to detect ADAM10, NOTCH2, MYC and JUN after treated by adavivint for 24 hours. “ADA” indicates “adavivint”. E) CCK8 assay is conducted to examine the survival inhibition ratio of FOLFOX regimen in the indicated organoids transfected by ADAM10‐overexpressing plasmid and NOTCH2 siRNA (n = 3). F) After transfected by ADAM10‐overexpressing plasmid, CCK8 assay is used to examine the survival inhibition ratio of regimen in the indicated organoids treated by MYC siRNA or JUN siRNA (n = 3). G) Synergistic index of adavivint and FOLFOX is calculated in the indicated dose in FOLFOX‐resistant organoids. H) The effect of combination of adavivint and FOLFOX on the growth of tumor in PDOX model established using the FOLFOX‐resistant organoids (n = 4). I) CCK8 assay is examine the relative viability of the FOLFOX‐resistant organoids transfected by ADAM10 siRNA (n = 3). J) Heatmap shows the synergistic index of adavivint and FOLFOX at different concentration in the indicated organoids. “ADA” indicates “adavivint” K) The effect of combination of adavivint and FOLFOX on the growth of tumor in PDOX model established using the indicated organoids (n = 4). All P‐values in are calculated using an unpaired two‐sided Student's t‐test, and data presented as mean ± SD. *p < 0.05, **p < 0.01, ***p < 0.001.
Figure 8
Figure 8
Mechanism of adavivint suppressing bypass ADAM10/NOTCH2/TCF7L2 signaling mediated transcriptional regulation of Wnt pathway to suppress tumor growth and overcome chemoresistance in CRC.

References

    1. Siegel R. L., Wagle N. S., Cercek A., Smith R. A., Jemal A., CA Cancer J. Clin. 2023, 73, 233. - PubMed
    1. Zhou H., Liu Z., Wang Y., Wen X., Amador E H., Yuan L., Ran X., Xiong Li, Ran Y., Chen W., Wen Yu, Signal Transduct. Target Ther. 2022, 7, 70. - PMC - PubMed
    1. Manfredi S., Lepage C., Hatem C., Coatmeur O., Faivre J., Bouvier A. M., Ann. Surg. 2006, 244, 254. - PMC - PubMed
    1. Cancer Genome Atlas Network , Nature 2012, 487, 330. - PubMed
    1. Tang J., Lam G. T., Brooks R D., Miles M., Useckaite Z., Johnson I Rd., Ung B S.‐Y., Martini C., Karageorgos L., Hickey S M., Selemidis S., Hopkins A M., Rowland A., Vather R., O'Leary J J., Brooks D A., Caruso M C., Logan J M., Cancer Lett. 2024, 585, 216639. - PubMed

MeSH terms

LinkOut - more resources