. 2025 Jan;265(1):99-109.
doi: 10.1002/path.6371. Epub 2024 Nov 27.

LINE-1 hypomethylation characterizes the inflammatory response in coeliac disease associated-intestinal mucosa and small bowel adenocarcinomas

Affiliations

LINE-1 hypomethylation characterizes the inflammatory response in coeliac disease associated-intestinal mucosa and small bowel adenocarcinomas

Laura Libera et al. J Pathol. 2025 Jan.

Abstract

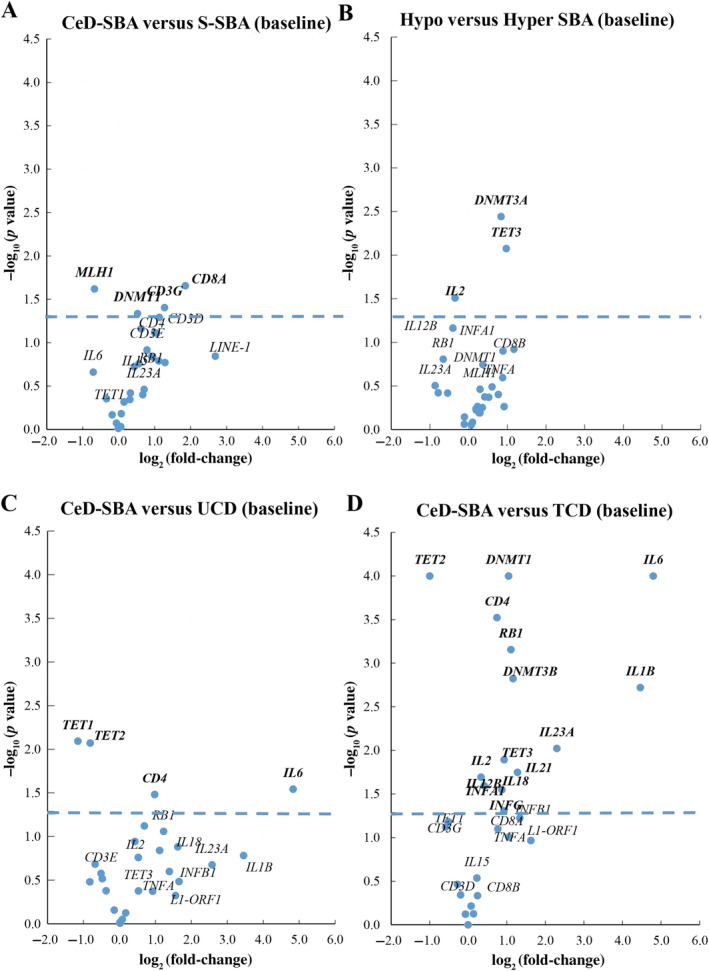
Long interspersed nuclear elements 1 (LINE-1) are the most abundant and the only autonomous mobile elements in the human genome. When their epigenetic repression is removed, it can lead to disease, such as autoimmune diseases and cancer. Coeliac disease (CeD) is an immune-mediated disease triggered by an abnormal T-cell response to dietary gluten and a predisposing condition of small bowel adenocarcinoma (SBA), frequently characterized by epigenetic alterations. The aim of this work was to assess LINE-1 methylation by bisulphite pyrosequencing and NanoString® gene transcription analysis in 38 CeD-SBAs compared with 25 SBAs associated with Crohn's disease (CrD-SBAs) and 25 sporadic SBAs (S-SBA). Both analyses were also performed in duodenal mucosae from 12 untreated CeD patients (UCD) and 19 treated CeD patients (TCD), and in 11 samples of normal intestinal mucosa to better investigate the role of LINE-1 deregulation in CeD and in CeD-SBA. A significant loss of LINE-1 methylation was observed in CeD-SBAs and in mucosae from UCD patients (with very similar methylation levels) compared with controls. By contrast, a restoration of normal LINE-1 methylation levels was found in TCD mucosae after a strict gluten-free diet. LINE-1 hypomethylation does not lead to expression of ORF1 and ORF2, with the only exception being for one CeD-SBA. The expression analysis of enzymes modulating DNA methylation and inflammatory genes confirmed that CeD-SBA shared a very similar expression profile of UCD mucosae showing a strong upregulation of genes involved in inflammation, immune response, and T-cell activity compared with TCD mucosae. For the first time, this work demonstrates that loss of DNA methylation is an intrinsic epigenetic feature of CeD, accompanying the immune response as a reversible mechanism in patients following a strict gluten-free diet, and suggests the possible role of LINE-1 hypomethylation in promoting cell adaptability during the gliadin-related inflammatory process. © 2024 The Author(s). The Journal of Pathology published by John Wiley & Sons Ltd on behalf of The Pathological Society of Great Britain and Ireland.

Keywords: LINE‐1 hypomethylation; LINE‐1 retrotransposition; coeliac disease; immune‐mediated disorders; small bowel adenocarcinomas.


Figures

Figure 1
Figure 1
Distribution of LINE‐1 methylation in small bowel adenocarcinomas (SBAs) and mucosae. (A) Box‐plot results of LINE‐1 methylation analysis among coeliac disease SBA (CeD‐SBA, n = 38, purple box), Crohn's disease SBA (CrD‐SBA, n = 25, blue box), sporadic SBA (S‐SBA, n = 25, yellow box), and normal mucosae from controls (Control, n = 11, white box). (B) Box‐plot results of LINE‐1 methylation analysis among coeliac disease SBA (CeD‐SBA, n = 38, purple box), duodenal mucosae from untreated CeD patients (UCD, n = 12, orange box) and treated CeD patients (TCD, n = 19, green box), and normal mucosae from controls (Control, n = 11, white box). Asterisks indicate the level of statistical significance: *p = 0.05–0.005, **p = 0.005–0.0001, ***p < 0.0001. The colour of the asterisks indicates the groups of comparison.
Figure 2
Figure 2
(A) Heatmap of the normalized data, scaled to give all genes equal variance, generated via unsupervised clustering. Expression values are scaled by gene to have a mean of 0 and a standard deviation (SD) of 1 and then truncated at ±3 SDs to preserve greater clarity in colour change within the largest proportion of data (99% of the data should fall within ±3 SDs). Sample annotations are listed at the top of the heatmap: MMR status (MSS in violet; MSI in pink; not available in green); LINE‐1 status (hypermethylated in yellow; hypomethylated in red); class groups (S‐SBA in orange; CeD‐SBA in grey; TCD in light blue; UCD in violet). The genes are displayed in rows. Each column is a unique sample, with a sample label displayed below the heatmap. MMR, mismatch repair status; MSI, presence of microsatellite instability; MSS, absence of microsatellite instability, na, not available; hyper, LINE‐1 hypermethylated; hypo, LINE‐1 hypomethylated; S‐SBA, sporadic SBA, CeD‐SBA, coeliac disease SBA; TCD, mucosae from coeliac disease patients in treatment; UCD, mucosae from coeliac disease untreated patients. (B) Principal component analysis maps high‐dimensional datasets onto a smaller number of highly informative dimensions. The figure shows the first four principal components of the gene expression data plotted against each other and coloured by class groups (S‐SBA in orange; CeD‐SBA in grey; TCD in light blue; UCD in violet). This plot shows the clustering of TCD and UCD mucosae separated from SBA samples.
Figure 3
Figure 3
(A–D) Volcano plots displaying each gene's transcript fold‐change (or difference on the log2 scale) and significance (p value) between CeD‐SBA and S‐SBA (A), between hypomethylated and hypermethylated SBA (B), between CeD‐SBA and UCD (C), and between CeD‐SBA and TCD (D) represented along the x‐axis, with the significance (p value) along the y‐axis. Genes that have greater statistical significance appear higher on the plot. Genes that have greater differential expression versus the baseline group (S‐SBA, hypermethylated SBA, UCD, or TCD, respectively) appear further from the centre of the plot. Genes further to the right indicate an increase in expression and genes further to the left indicate a decrease in expression relative to the baseline group. The horizontal blue line indicates 0.05 p value threshold.

References

    1. Platt RN, Vandewege MW, Ray DA. Mammalian transposable elements and their impacts on genome evolution. Chromosome Res 2018; 26: 25–43. - PMC - PubMed
    1. Werren JH. Selfish genetic elements, genetic conflict, and evolutionary innovation. Proc Natl Acad Sci U S A 2011; 108: 10863–10870. - PMC - PubMed
    1. Kale SP, Moore L, Deininger PL, et al. Heavy metals stimulate human LINE‐1 retrotransposition. Int J Environ Res Public Health 2005; 2: 14–23. - PMC - PubMed
    1. Streicher F, Jouvenet N. Stimulation of innate immunity by host and viral RNAs. Trends Immunol 2019; 40: 1134–1148. - PubMed
    1. Swergold GD. Identification, characterization, and cell specificity of a human LINE‐1 promoter. Mol Cell Biol 1990; 10: 6718–6729. - PMC - PubMed

Publication types

MeSH terms