Randomized Controlled Trial
. 2024 Dec;21(1):2433744.
doi: 10.1080/15502783.2024.2433744. Epub 2024 Nov 27.

Salidroside and exercise performance in healthy active young adults - an exploratory, randomized, double-blind, placebo-controlled study

Affiliations
Randomized Controlled Trial

Salidroside and exercise performance in healthy active young adults - an exploratory, randomized, double-blind, placebo-controlled study

Neil A Schwarz et al. J Int Soc Sports Nutr. 2024 Dec.

Abstract

Background: Rhodiola rosea extract is purported to improve physical performance and support resilience to stress. Salidroside is considered to be one of the main constituents responsible for the ergogenic actions of R. rosea. However, R. rosea extract contains relatively little salidroside and cultivation of R. rosea is challenging as it is mainly found in high-altitude, cold regions. Additionally, the R. rosea plant is subject to conservation concerns because of its growing popularity. The purpose of this exploratory study was to evaluate the short-term effects of pure, biosynthetic salidroside supplementation on exercise performance, mood state, and markers of inflammation and muscle damage in healthy active young adults.

Methods: Fifty participants (30 M, 20F; 21 ± 4 yrs; 173 ± 8 cm; 74 ± 13 kg) were randomly assigned to either salidroside (60 mg/day for 16 days) or placebo supplementation and underwent peak oxygen uptake (VO2 peak), intermittent time-to-exhaustion (TTE), and local muscular endurance assessments, along with mood state evaluations using the Profile of Mood States (POMS). Blood samples were analyzed for erythropoietin, myoglobin, creatine kinase-MM, and C-reactive protein.

Results: Salidroside supplementation enhanced overall percent predicted oxygen uptake during high-intensity intermittent exercise (p < 0.01). An increase in serum myoglobin was observed 24 hours following exercise in the placebo group (p = 0.02) compared with baseline whereas no statistically significant increase was observed for the salidroside group indicating reduced exercise-induced muscle damage. Placebo group experienced a decrease in number of intervals performed during the TTE test (p = 0.03), and a decrease in friendliness (p < 0.01) and an increase in fatigue-inertia (p < 0.01) as reported by POMS. The salidroside group exhibited stable mood states and maintained performance levels during the time-to-exhaustion test.

Conclusion: Salidroside supplementation may enhance oxygen utilization and mitigate exercise-induced muscle damage and fatigue, warranting further research on its long-term effects and potential as an adaptogen for active individuals.

Keywords: Salidroside; adaptogen; golden root; high-intensity interval exercise; oxygen consumption; rhodiola rosea.


Conflict of interest statement

N.A.S. has a perceived conflict of interest as the recipient of funds used to perform the study. N.A.S. has no financial or commercial interest in the outcome of the study and declares that the research was conducted in the absence of any commercial or financial relationships that could be construed as a potential conflict of interest. M.T.S, R.J.C., A.M.M., C.C.W., H.D., M.C.D., and G.M.H. have no commercial or financial interests in the outcome of the study. F.M. and M.S. are employees of Gnosis by Lesaffre, Lesaffre Group. C.R.V., H.C.S., and P.G.K. were employees of DoubleRainbow Biosciences Inc. at the time of study implementation. C.R.V. is an employee of Recombia Biosciences by Lesaffre. J.-K.W. is a member of the Scientific Advisory Board and a shareholder of DoubleRainbow Biosciences, Galixir and Inari Agriculture, which develop biotechnologies related to natural products, drug discovery, and agriculture.

Figures

Figure 1.
Figure 1.
Overview of study design. Created with BioRender.com.
Figure 2.
Figure 2.
Overview of time-to-exhaustion test protocol. sVO2 = speed associated with the participant’s VO2 peak; created with BioRender.com.
Figure 3.
Figure 3.
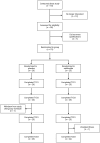
CONSORT flow diagram. Created with BioRender.com.
Figure 4.
Figure 4.
Effect of salidroside on oxygen uptake during time-to-exhaustion test at T1D3. The bars represent the mean percentage of predicted oxygen uptake (% predicted O₂ uptake) across work intervals during the time-to-exhaustion test for salidroside (red bars) and placebo (blue bars). Significant differences between the placebo and salidroside groups are indicated by asterisks (*), with salidroside showing a higher percentage of predicted O₂ uptake at interval 1, interval 2, interval 3, and middle intervals. No significant difference is observed during final intervals. Error bars represent standard deviations.
Figure 5.
Figure 5.
Effect of salidroside on oxygen uptake during time-to-exhaustion test at T2D3. The bars represent the mean percentage of predicted oxygen uptake (% predicted O₂ uptake) across work intervals during the time-to-exhaustion test for salidroside (red bars) and placebo (blue bars). Significant differences between the placebo and salidroside groups are indicated by asterisks (*), with salidroside showing a higher percentage of predicted O₂ uptake at interval 1 and middle intervals. No significant differences are observed during interval 2, interval 3, and final intervals. Error bars represent standard deviations.
Figure 6.
Figure 6.
Overall effect of salidroside on percent predicted oxygen uptake during time-to-exhaustion tests. The bars represent the mean overall percentage of predicted oxygen uptake during the time-to-exhaustion tests, combining both sessions (T1D3 and T2D3) and all work intervals for both placebo (blue bar) and salidroside (red bar) groups. The salidroside group shows significantly higher overall oxygen uptake compared to the placebo group, as indicated by the asterisk (*). Error bars represent standard deviations.
Figure 7.
Figure 7.
Percent predicted oxygen uptake for each interval grouping (sessions and groups collapsed) during time-to-exhaustion tests. The bars represent the mean percentage predicted oxygen uptake for each interval grouping during the time-to-exhaustion tests, combining both sessions and groups. Percentage predicted oxygen uptake for interval 1 is significantly lower than interval 2, interval 3, middle intervals (MI), and final intervals (FI). Interval 2 is significantly lower than interval 3, MI, and FI. Interval 3 is significantly lower than MI. Error bars represent standard deviations.
Figure 8.
Figure 8.
Number of intervals completed by each group during time-to-exhaustion tests at each session. The bars represent the mean number of intervals completed during the time-to-exhaustion tests at T1D3 (blue bars) and T2D3 (red bars) for the placebo and salidroside groups. The placebo group performed significantly fewer intervals at T2D3 compared with T1D3, as indicated by the asterisk (*). Error bars represent standard deviations.
Figure 9.
Figure 9.
Profile of mood states output for each dimension by group and time point. The bars represent the mean Z-score for each profile of mood states (POMS) dimension at T1D1 (blue bars) and T2D1 (red bars) for placebo and salidroside groups. The placebo group shows significantly higher fatigue-inertia and significantly lower friendliness at T2D1 compared with T1D1, as indicated by the asterisks (*). A trend for greater total mood disturbance at T2D1 compared with T1D1 was observed for the placebo group (p = 0.06). Error bars represent standard deviations.
Figure 10.
Figure 10.
Peak absolute (A) and relative oxygen consumption (B) by group and time point. The bars represent mean peak absolute oxygen consumption (VO₂; panel A) and peak relative VO₂ (panel B) for salidroside and placebo at T1D1 (blue bars) and T2D1 (red bars). No significant differences observed. Error bars represent standard deviations.
Figure 11.
Figure 11.
Total repetitions and repetitions performed at each load intensity. The bars represent the mean number of total repetitions performed and number of repetitions performed at each intensity of one-repetition maximum (1-RM) for both placebo (blue bars) and salidroside (red bars) groups. No significant differences in repetitions performed between groups were observed. Error bars represent standard deviations.
Figure 12.
Figure 12.
Erythropoietin (EPO) plasma levels by group and time point. The bars represent the mean concentration of plasma erythropoietin (EPO) at T1D1 (blue bars) and at T2D1 (red bars) for both placebo and salidroside groups. No significant differences in EPO were observed. Error bars represent standard deviations.
Figure 13.
Figure 13.
Highly sensitive C-reactive protein (hs-crp, panel A) and muscle-specific creatine kinase (CK-MM, panel B) plasma levels by group and time point. The bars represent the mean concentration of (A) highly sensitive C-reactive protein (hs-crp) and (B) muscle-specific creatine kinase (CK-MM) before exercise at T2D1 (pre-Ex; blue bars), at 24 hours post-exercise on T2D2 (24PoEx; red bars), and at 48 hours post-exercise on T2D3 (48PoEx; dotted bars) for both placebo and salidroside groups. No significant differences in hs-crp or CK-MM levels were observed. Error bars represent standard deviations.
Figure 14.
Figure 14.
Serum myoglobin (MYO) levels by group and time point. The bars represent the mean concentration of serum myoglobin (MYO) before exercise at T2D1 (pre-Ex; blue bars), at 24 hours post-exercise on T2D2 (24PoEx; red bars), and at 48 hours post-exercise on T2D3 (48PoEx; dotted bars) for both placebo and salidroside groups. MYO was significantly higher at T2D2/24PoEx compared with the other two time points for the placebo group as denoted by the asterisk (*). Error bars represent standard deviations.

References

    1. Malsagova KA, Kopylov AT, Sinitsyna AA, et al. Sports nutrition: diets, selection factors, recommendations. Nutrients. 2021;13(11):3771. doi: 10.3390/nu13113771 - DOI - PMC - PubMed
    1. Maughan RJ, Burke LM, Dvorak J, et al. IOC consensus statement: dietary supplements and the high-performance athlete. Br J Sports Med. 2018;52(7):439–28. doi: 10.1136/bjsports-2018-099027 - DOI - PMC - PubMed
    1. Panossian A, Wikman G, Sarris J.. Rosenroot (rhodiola rosea): traditional use, chemical composition, pharmacology and clinical efficacy. Phytomedicine. 2010;17(7):481–493. doi: 10.1016/j.phymed.2010.02.002 - DOI - PubMed
    1. Lu Y, Deng B, Xu L, et al. Effects of Rhodiola Rosea supplementation on exercise and sport: a systematic review. Front Nutr [Internet]. 2022;9. doi: 10.3389/fnut.2022.856287 - DOI - PMC - PubMed
    1. Amsterdam JD, Panossian AG. Rhodiola rosea L. as a putative botanical antidepressant. Phytomedicine. 2016;23(7):770–783. doi: 10.1016/j.phymed.2016.02.009 - DOI - PubMed

Publication types

MeSH terms