. 2024 Dec 3;121(49):e2411389121.
doi: 10.1073/pnas.2411389121. Epub 2024 Nov 27.

Genetic evidence against involvement of TRPC proteins in SOCE, ROCE, and CRAC channel function

Affiliations

Genetic evidence against involvement of TRPC proteins in SOCE, ROCE, and CRAC channel function

Sebastian Susperreguy et al. Proc Natl Acad Sci U S A. .

Abstract

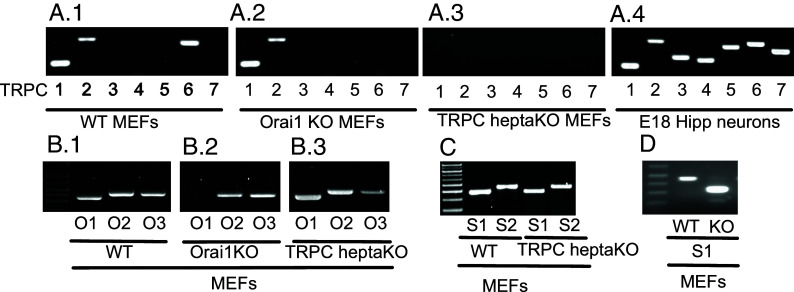
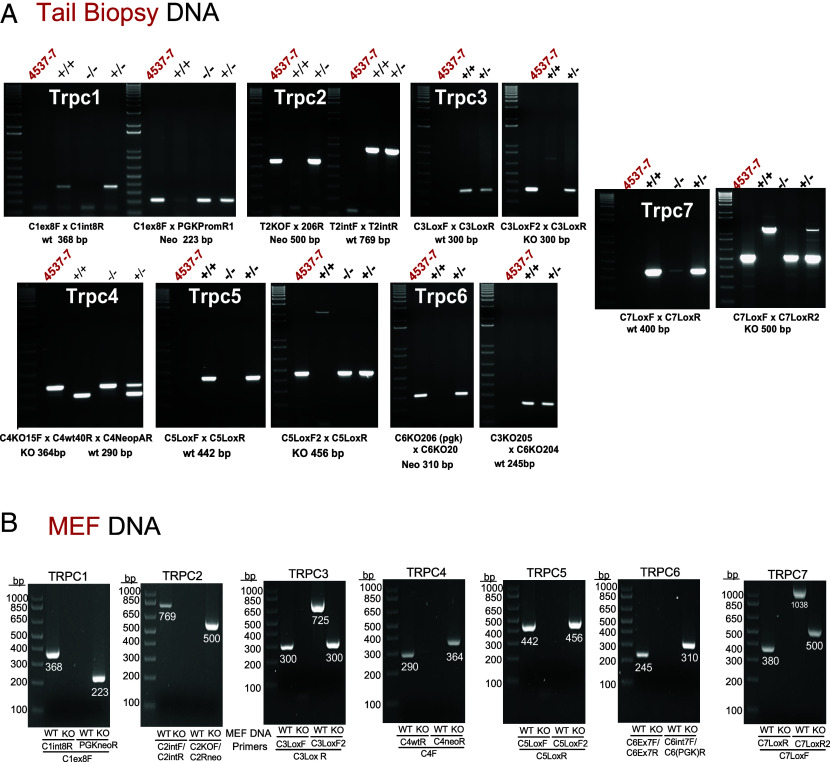
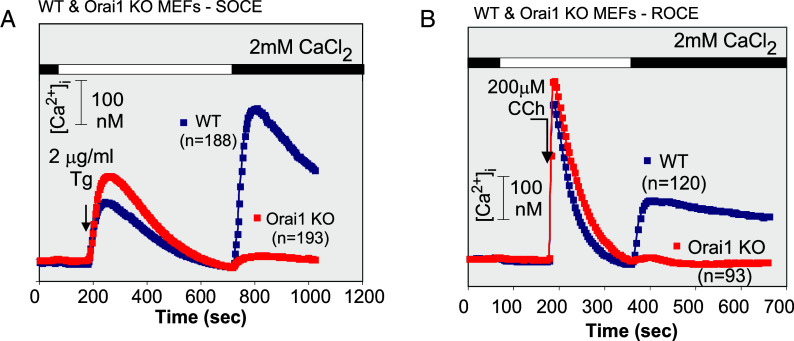
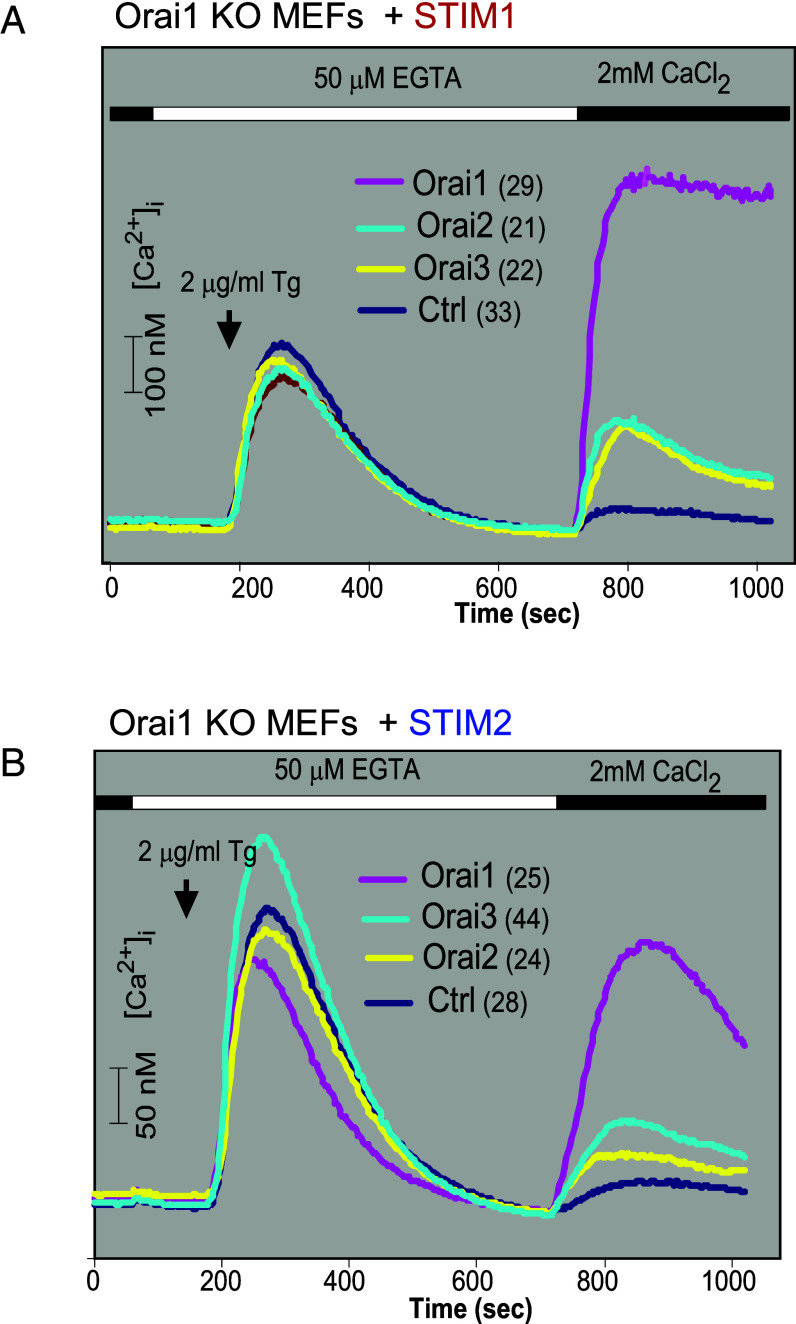
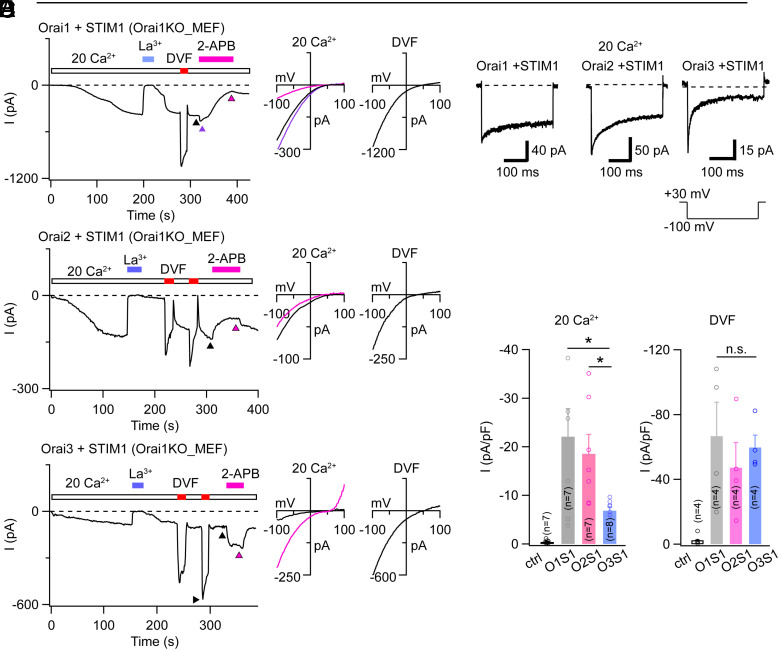
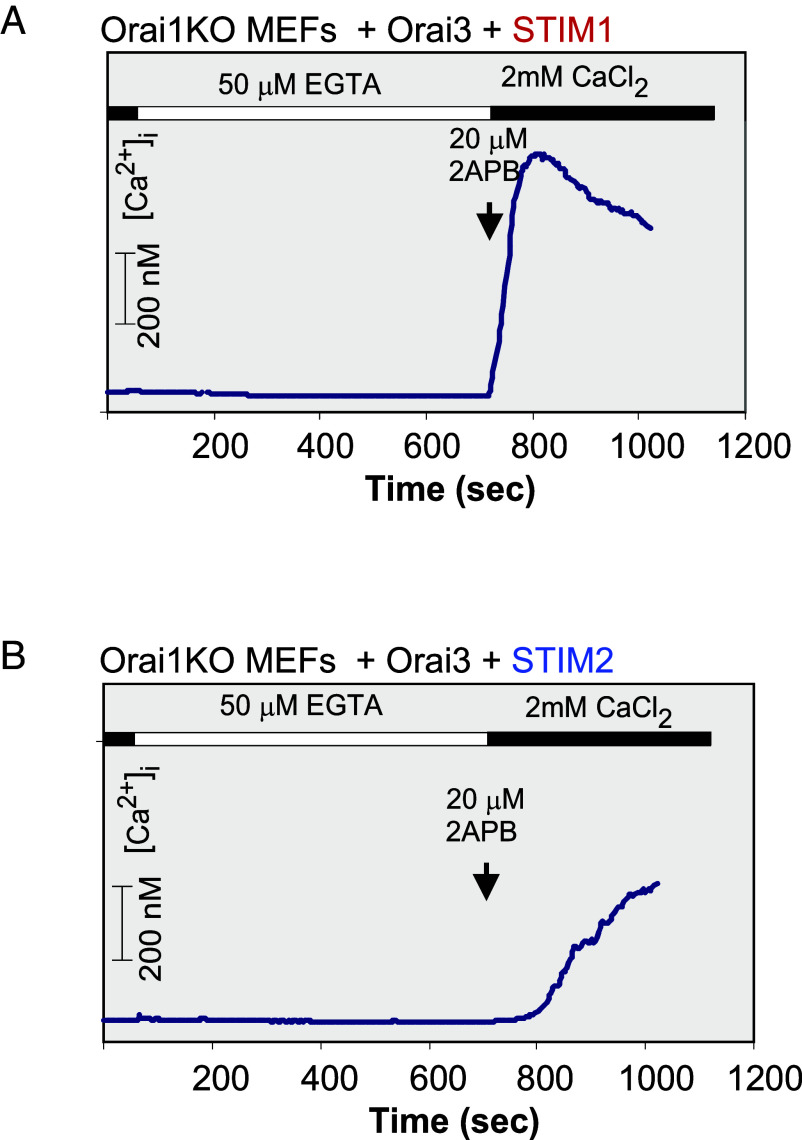
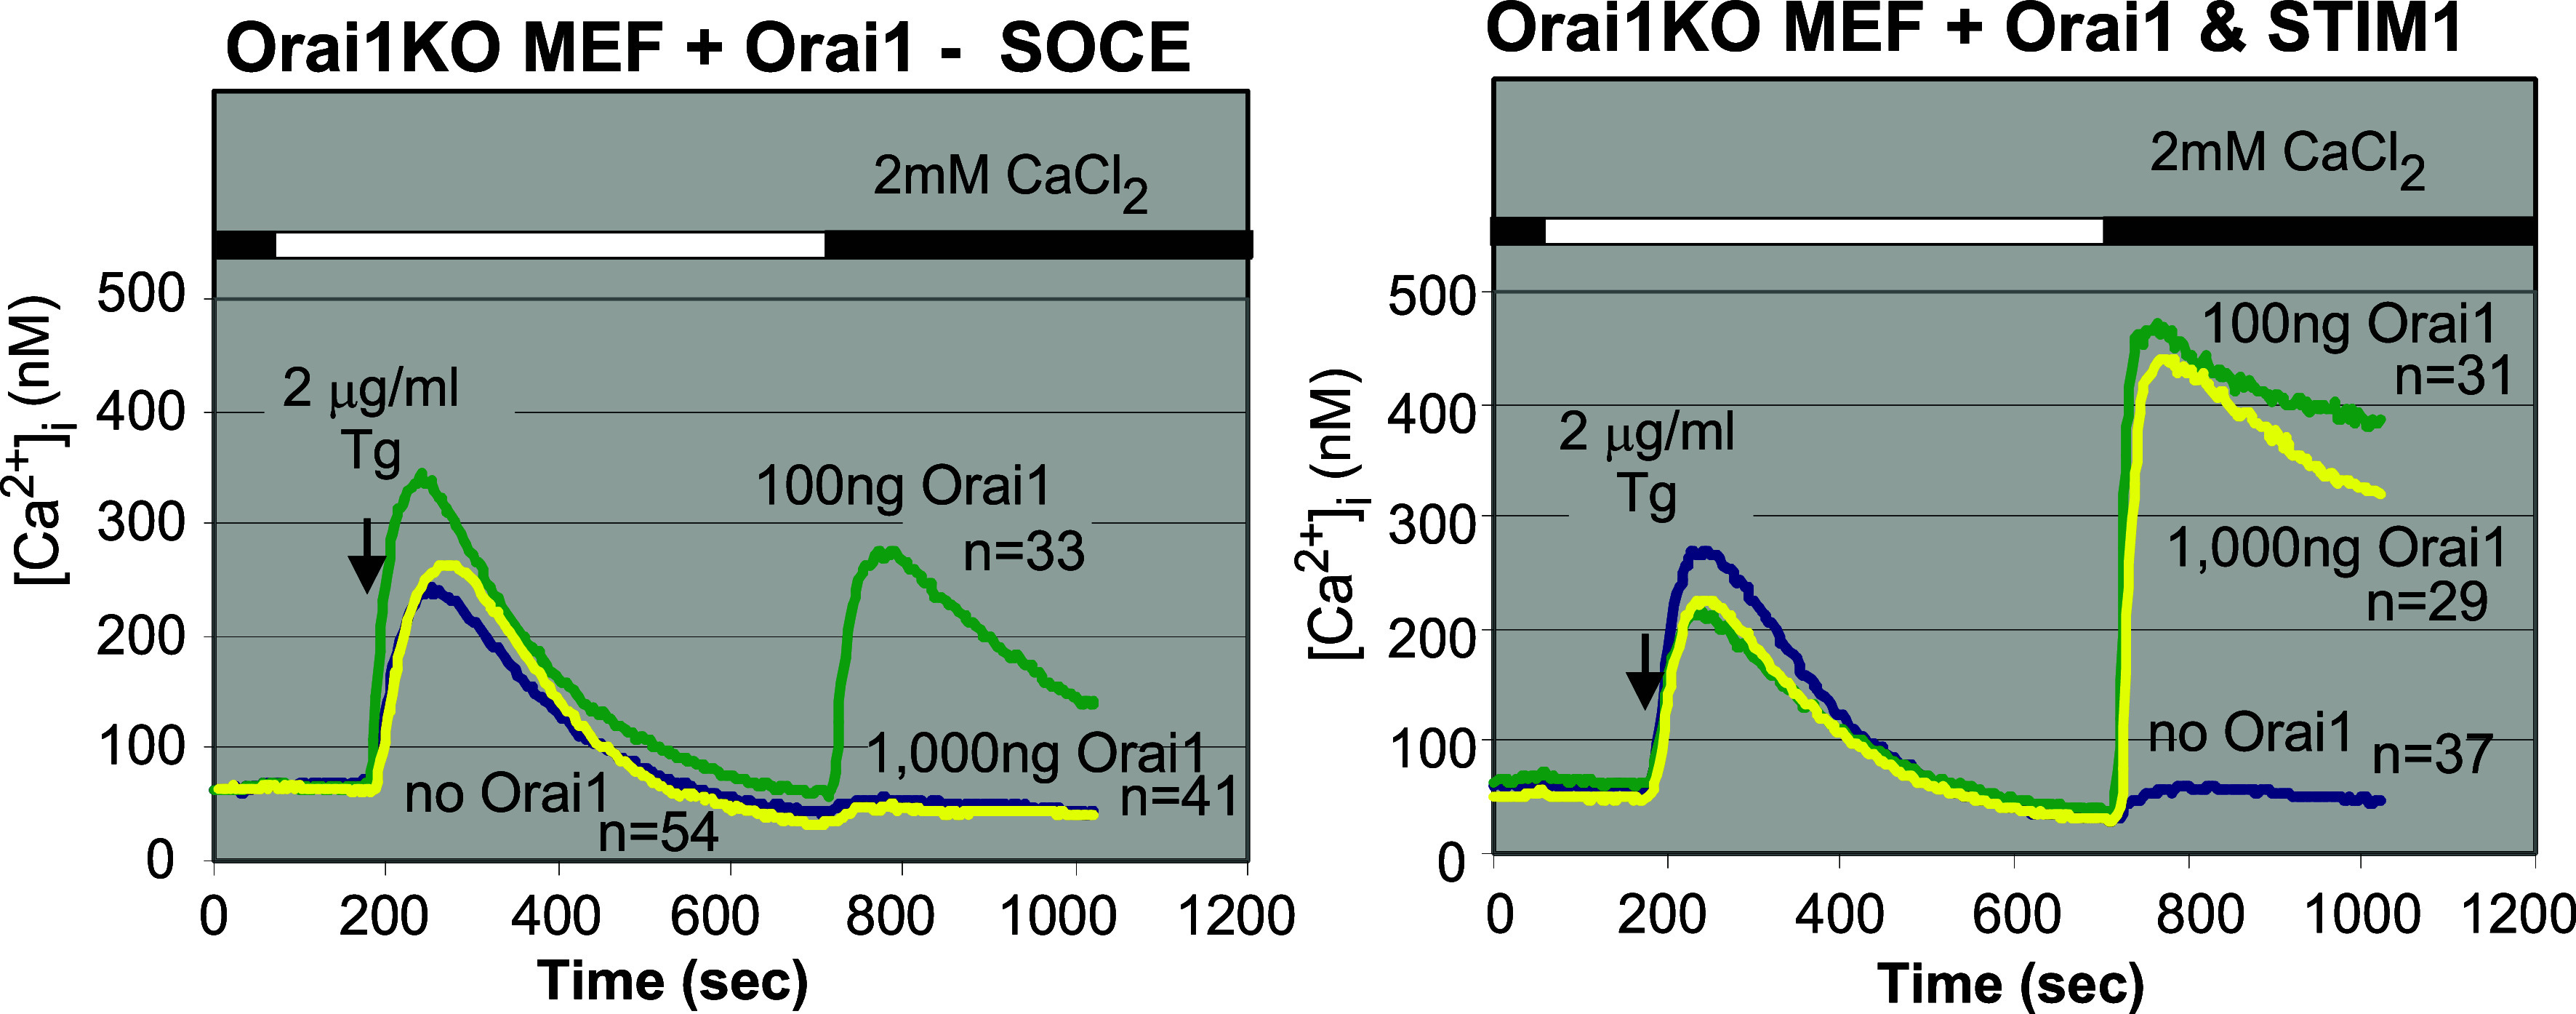
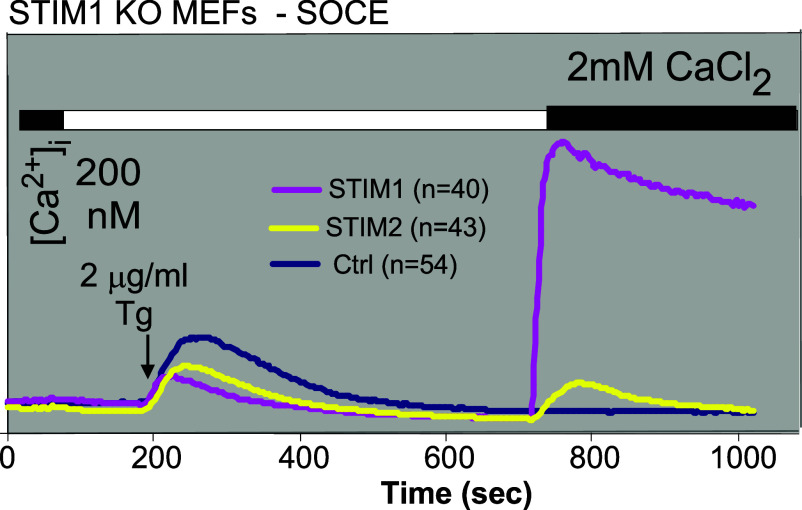
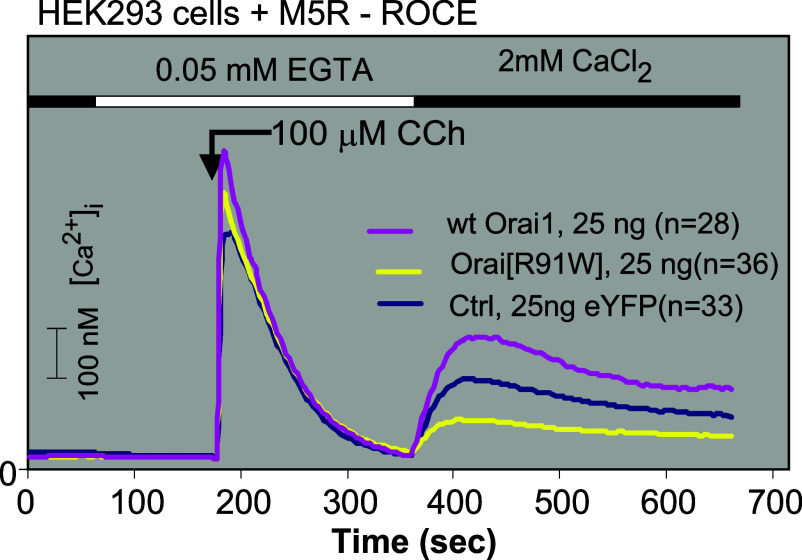
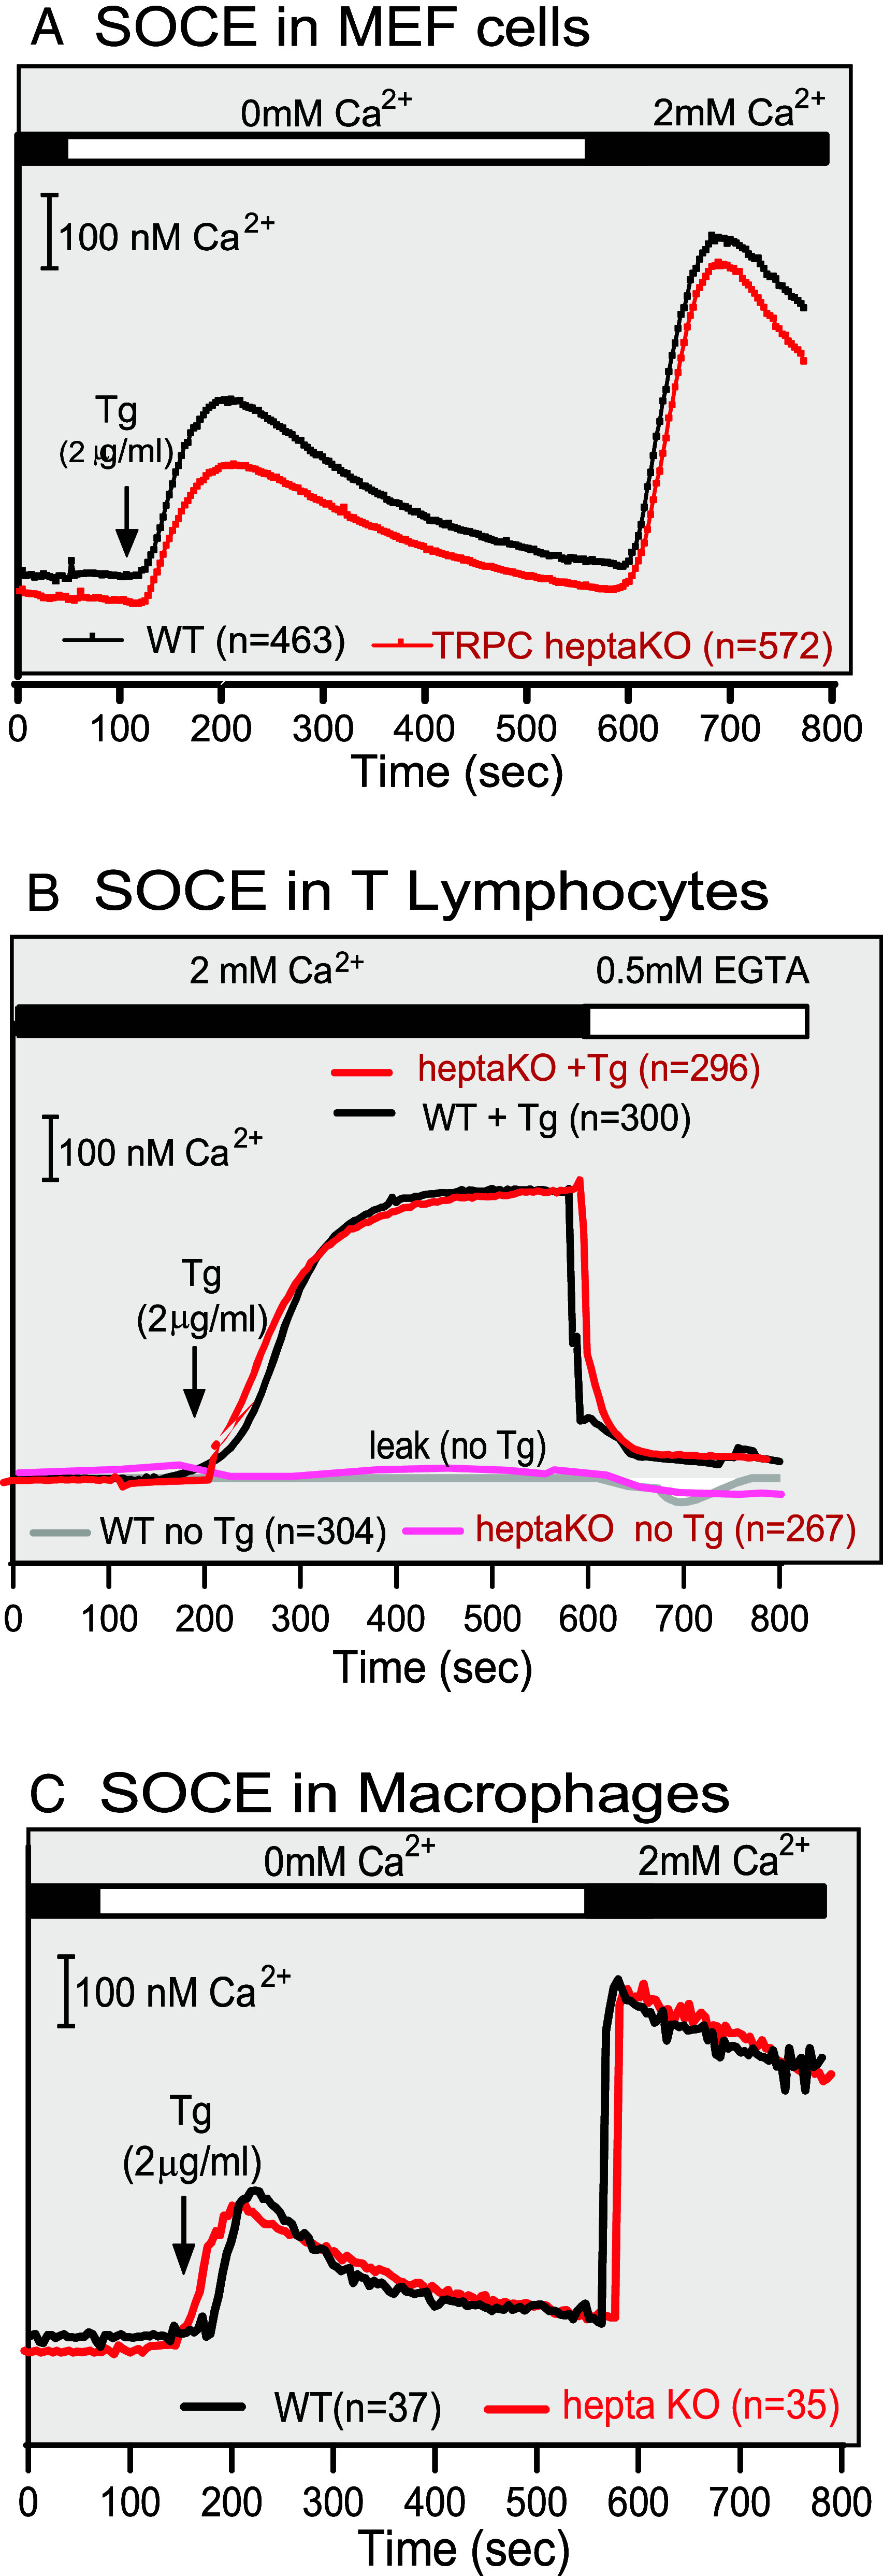
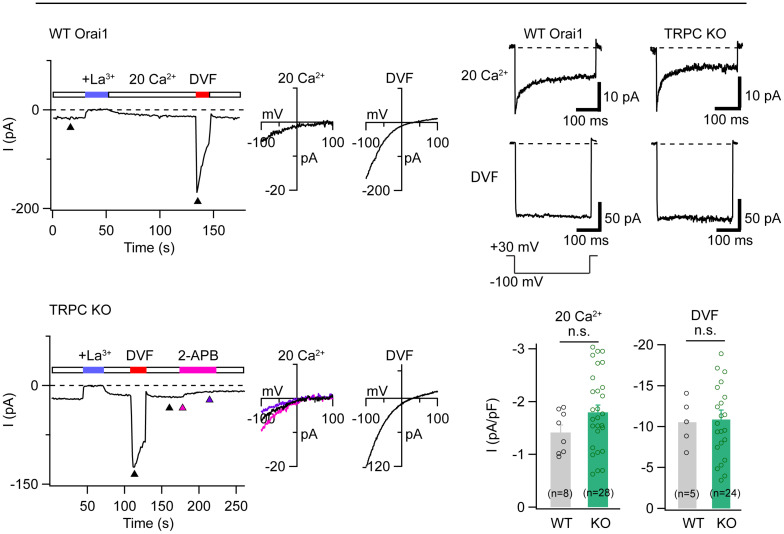
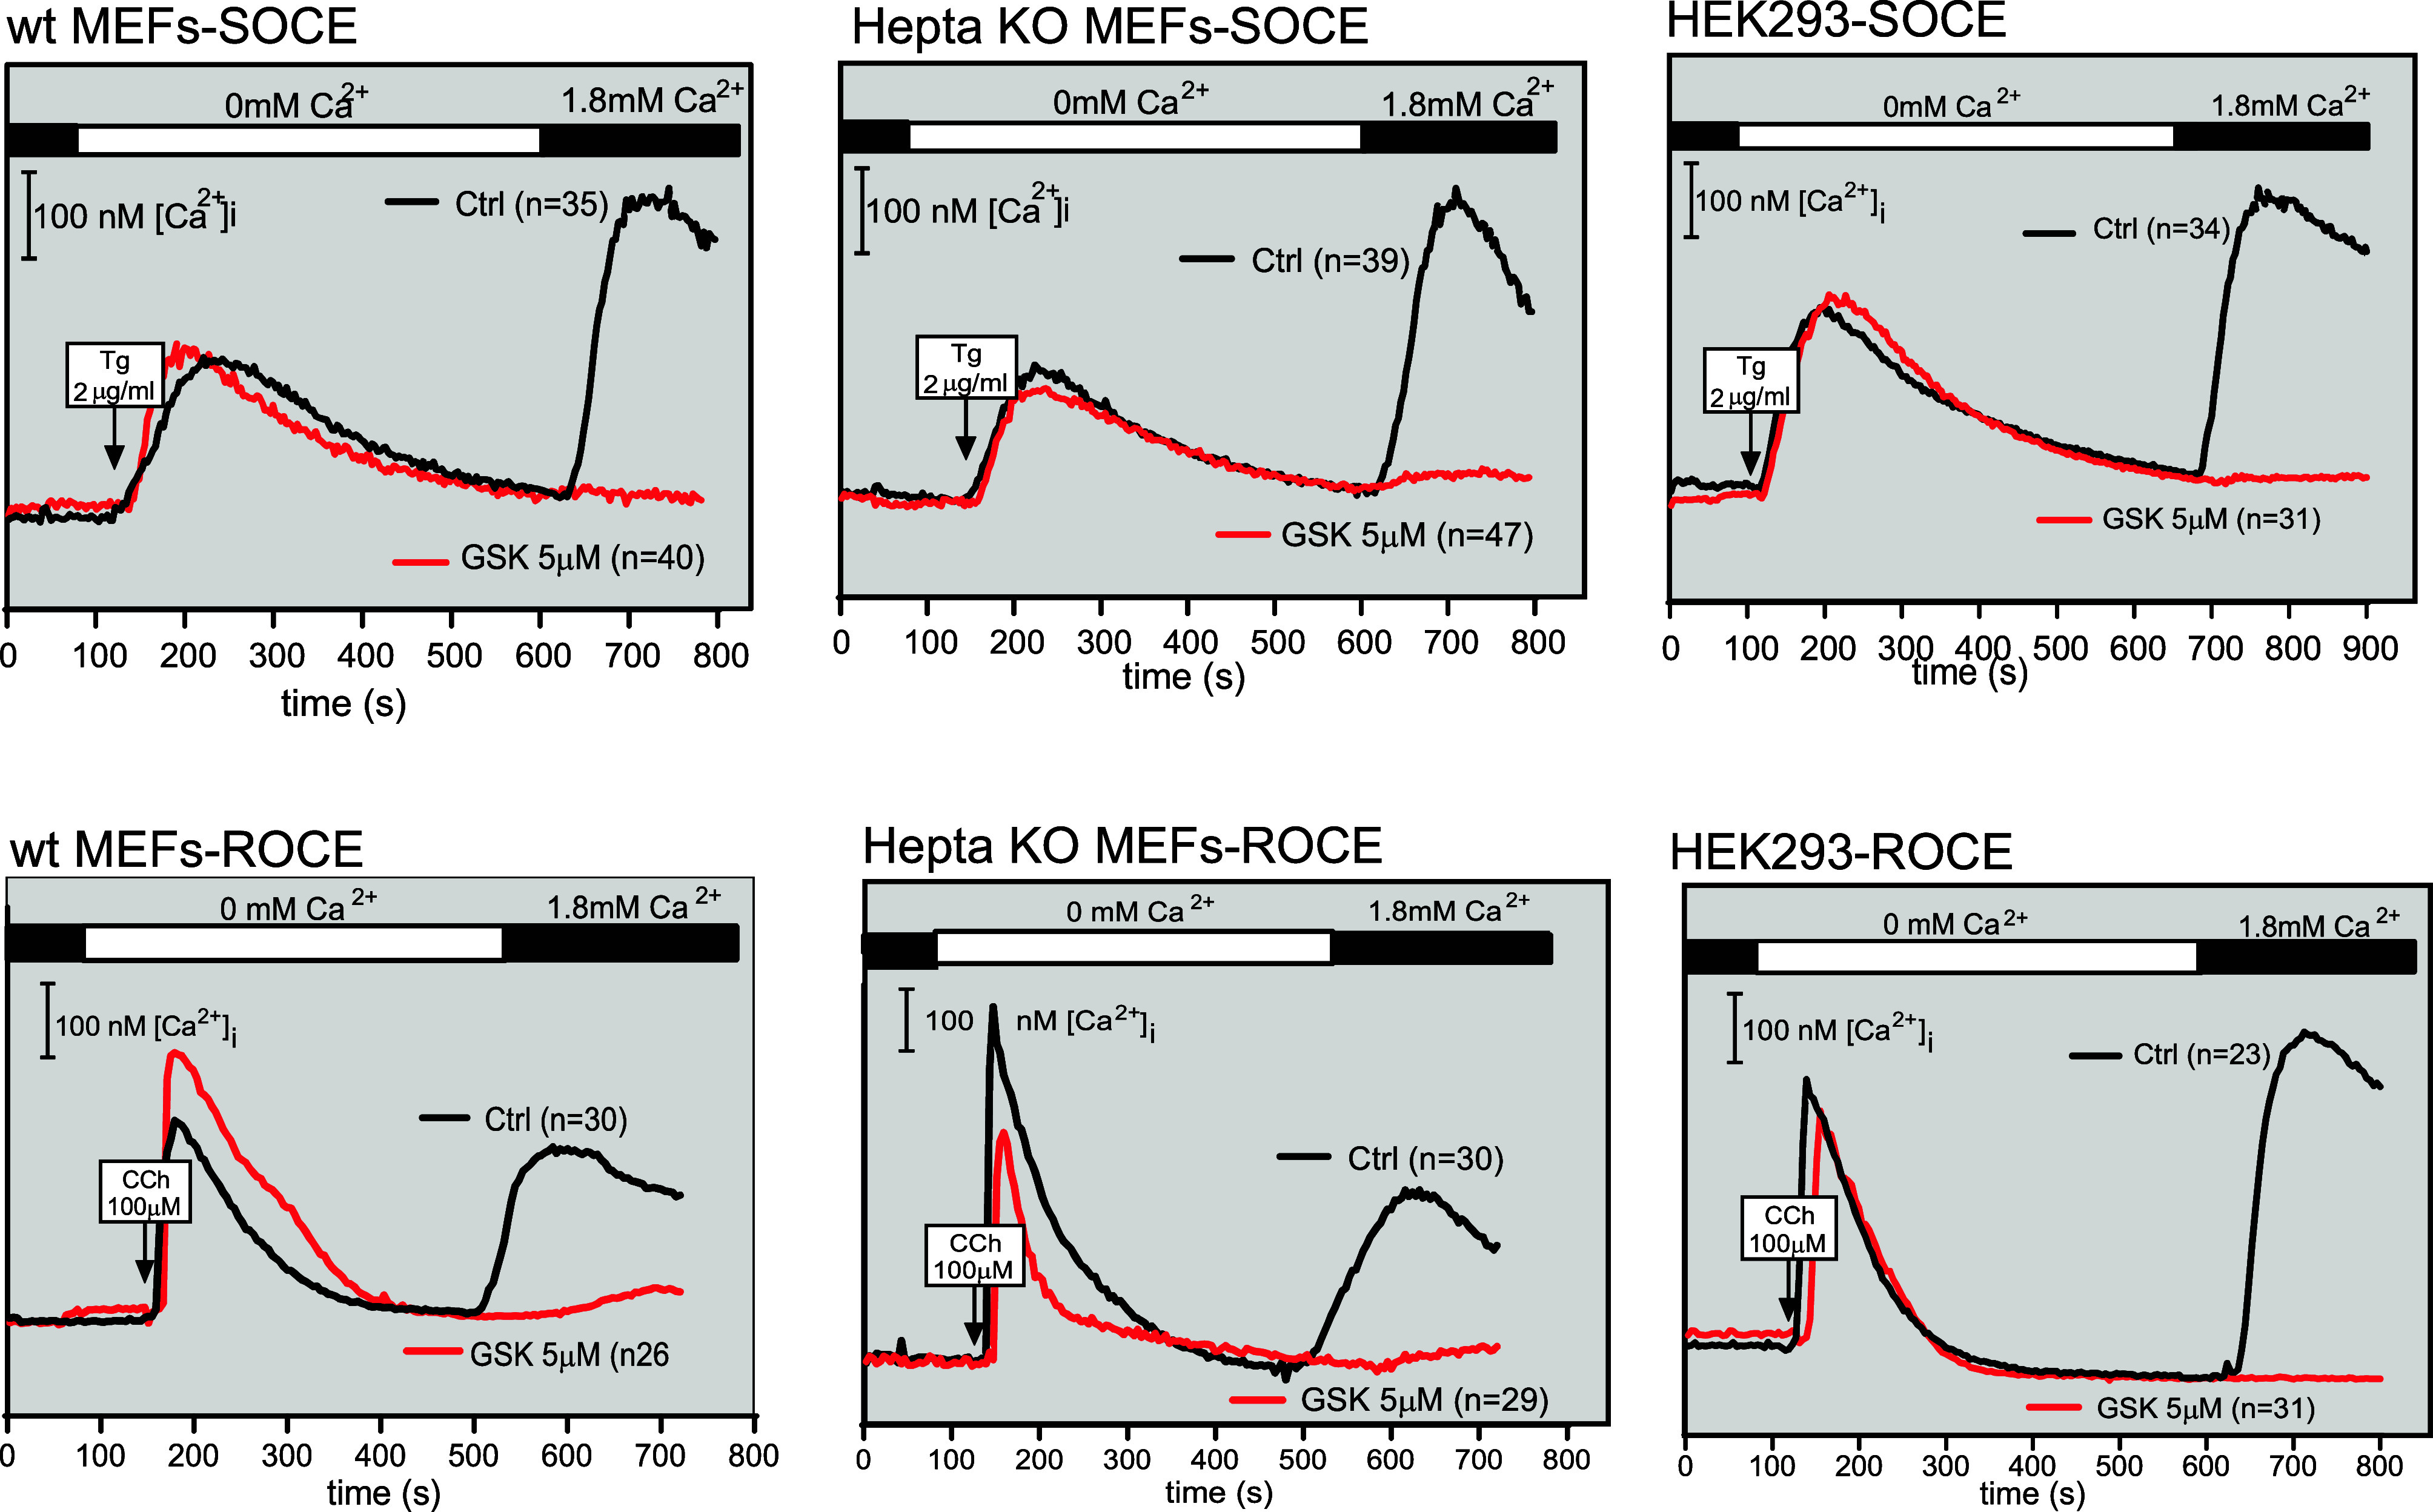
Using genetically engineered mice and cell lines derived from genetically engineered mice we show that depletion of ER delimited Ca2+ stores activates heteromeric Ca2+ entry (SOCE) channels formed obligatorily, but not exclusively by Orai1 molecules. Comparison of Orai-dependent Ca2+ entries revealed Orai1 to be dominant when compared to Orai2 and Orai3. Unexpectedly, we found that store-depletion-activated Ca2+ entry does not depend obligatorily on functionally intact TRPC molecules, as SOCE monitored with the Fura2 Ca2+ reporter dye is unaffected in cells in which all seven TRPC coding genes have been structurally and functionally inactivated. Unexpectedly as well, we found that TRPC-independent Gq-coupled receptor-operated Ca2+ entry (ROCE) also depends on Orai1. Biophysical measurements of Ca2+ release activated Ca2+ currents (Icrac) are likewise unaffected by ablation of all seven TRPC genes. We refer to mice and cells carrying the seven-fold disruption of TRPC genes as TRPC heptaKO mice and cells. TRPC heptaKO mice are fertile allowing the creation of a new homozygous inbred strain.

Keywords: Orai; ROCE; SOCE; TRPC.


Conflict of interest statement

Competing interests statement:The authors declare no competing interest.

Figures

Fig. 1.
Fig. 1.
Expression of full complements of three Orai and two STIM genes but only limited expression of TRPC genes in MEF cells. (A1) WT MEF cells only express TRPC1, -2, and -6, of which (A2) only TRPC1 and -2 are present in Orai1 KO MEF cells. (A3) MEF cells derived from TRPC heptaKO mice lack all seven TRPC mRNAs. (A4) Positive control RT-PCR analysis of RNA derived from E18 mouse hippocampal neurons in which all seven TRPC genes are expressed. (B1–B3) Orai1, -2, and -3 are expressed in wt and TRPC heptaKO MEF cells. (B2) Orai1 mRNA is absent in Orai1 KO MEF cells. (C) STIM 1 and STIM2 are present in wt and heptaKO MEF cells. (D) Confirmation of gene disruption in STIM1 KO MEF cells. Primer sequences and RNA isolation procedures are described in Materials and Methods.
Fig. 2.
Fig. 2.
(A) PCR analysis of the sevenfold, total Trpc KO genotype of female mouse tag #4537-7. Reactions were in 25 or 50 µL final volume. 10 µL of the each reaction was used for the electrophoreses shown. For primer set composition and cycling programs, see Materials and Methods. The gDNAs analyzed in each lane (4537-7, +/+, +/−) are depicted above the photographs of the electrophoretic runs, the primer combinations, and expected amplicon sizes are depicted below. M: 1 kb DNA ladder (Invitrogen) low to high, in bp: 100, 200, 300, 400, 500, 650, 850, 1,000, 1,650, 2,000 was used to calibrate the size of the reaction products. (B) Preservation of the TRPC heptaKO genotype in MEF cells from the established TRPC heptaKO mouse strain.
Fig. 3.
Fig. 3.
Orai1-Deficient MEFs Exhibit Essentially no SOCE or ROCE. (A) SOCE promoted store depletion by inhibition of SERCA pumps with Thapsigargin (Tg) In Orai1 KO MEF cells. (B) ROCE triggered by Carbachol (CCh) induced activation of the transfected Gq- coupled M5 muscarinic receptor in Orai1 KO MEF cells.
Fig. 4.
Fig. 4.
All Orai genes are able to Form CRAC channels. Coexpression of transfected Orai with (A) STIM1 and (B) STIM2 cDNAs, in Orai1 KO MEF cells reveals the ability to form CRAC channels by all Orai proteins, but at differing efficiencies.
Fig. 5.
Fig. 5.
Properties of CRAC currents arising from expression of different Orai isoforms in Orai1 KO MEFs. (AC) Leak-corrected CRAC currents arising from overexpression of Orai1 (A), Orai2 (B), or Orai3 (C) in Orai1 KO MEFs. The membrane potential was stepped to −100 mV for 100 ms followed by a ramp from −100 to +100 mV for 100 ms. The traces plot the peak Orai current during the −100 mV voltage step over time. Orai1 KO MEF cells were transfected with CFP-Orai1, CFP-Orai2, or YFP-Orai3 together with mCherry STIM1. ICRAC was activated by 8 mM BAPTA in the pipette. The standard extracellular Ringer solution (20 mM Ca2+) was periodically switched with a Na+-based DVF solution at the indicated time points, revealing the conduction of Na+ currents in the absence of extracellular divalent ions. Leak-subtraction was performed by subtracting the current in the presence of 100 µM LaCl3. 50 µM 2-aminoethoxydiphenyl borate (2-APB) was applied at the indicated time points. For Orai1, administration of 2-APB evokes a biphasic response with initial potentiation followed by strong inhibition. Orai2 currents are only modestly inhibited by 2-APB. By contrast, Orai3 channels are strongly activated by 2-APB, resulting in large nonselective Orai3 currents. The current–voltage (I–V) relationship of the Orai currents in 20 mM Ca2+ and DVF solutions obtained at the time point indicated by the arrowhead are shown in the Right graphs. (D) Calcium-dependent inactivation (CDI) of Orai currents overexpressed in Orai1 KO MEFs. The traces show currents arising from the indicated Orai isoform during 300-ms hyperpolarizing steps to −100 mV in 20 mM Ca2+o Ringer’s solution. The internal solution contained 8 mM BAPTA. (E) Summary graphs of current densities of ICRAC in the presence of 20 mM Ca2+o and DVF solutions in Orai1 KO MEF cells (ctrl), and in Orai1 KO MEFs overexpressing Orai1, Orai2, or Orai3 together with STIM1. These current densities are (in 20 mM Ca2+o): −0.42 ± 0.13 pA/pF (n = 7) (Orai1 KO MEFs, Ctrl), −22.1 ± 5.8 pA/pF (n = 7) (Orai1+STIM1), −18.6 ± 4.0 pA/pF (n = 7) (Orai2+STIM1) and −6.8 ± 0.8 pA/pF (n = 8) (Orai3+STIM1) (*P <0.05). In DVF solution, the current densities are −2.5 ± 1.0 pA/pF (Ctrl, n = 7), −66.7 ± 21.0 pA/pF (Orai1 + STIM1, n = 4), −47.3 ± 15.5 pA/pF (Orai2 +STIM1, n = 4), and −59.8 ± 7.6 pA/pF (Orai3 + STIM1, n = 4), respectively (*P >0.05). Values are mean ± SEM.
Fig. 6.
Fig. 6.
Unactivated STIM proteins affect the kinetics and extent of activation of Orai3 by 2-APB. Tg-activated SOCE in Orai1 KO MEF cells cotransfected with Orai3 and (A) STIM1 or (B) STIM2 cDNAs.
Fig. 7.
Fig. 7.
Dual action of Exogenous Orai1 on SOCE in Orai1 KO MEF cells. (A) Low levels. of Orai1 reconstitutes SOCE, whereas high levels inhibit SOCE. (B) Scavenging excess Orai1 with STIM1 uncovers the reconstituting action of Orai1.
Fig. 8.
Fig. 8.
Failure of store depletion to trigger Ca2+ entry in STIM1 KO MEFs and reconstitution of SOCE in STIM1 KO MEFs by expression of exogenous STIM1 or STIM2. Tg-activated SOCE in STIM1 KO MEF cells transfected with STIM1 or STIM2 cDNAs.
Fig. 9.
Fig. 9.
Inhibition of M5R triggered ROCE by expression of the SCID-causing Orai1 mutant [R91W] Orai1 and enhancement of ROCE by wt Orai1. HEK293 cells were transfected with 25 ng pcDNA3 driving the expression of the indicated Orai1 molecules, the M5R, and TRPC6 N-terminally tagged with EYFP.
Fig. 10.
Fig. 10.
SOCE is unaffected by the absence of all TRPC proteins. (A) Intact SOCE in TRPC-HeptaKO MEFs. (B) Intact SOCE in naïve T cells of TRPC heptaKO mice. (C) Intact SOCE in bone marrow–derived macrophages (BMDM) of TRPC heptaKO mice.
Fig. 11.
Fig. 11.
CRAC channel currents are unaffected in TRPC heptaKO T cells. (A and B) Leak-corrected CRAC channel currents in WT and TRPC heptaKO MEF cells. The graph on the Left shows the peak CRAC current amplitude measured during hyperpolarizing steps to −100 mV plotted against time. The I–V plots of Ca2+ and monovalent currents are shown on the Right. Currents were induced by pretreating cells with thapsigargin prior to the recording (5 min). The extracellular Ringer solution (20 mM Ca2+) was periodically switched with a Na+ -based DVF (divalent-free) solution, revealing permeation of Na+ ions in the absence of extracellular divalent ions. ICRAC is completely inhibited by 100 mM LaCl3. I–V relationships were measured at times indicated by the arrowheads. 2APB (50 µM) inhibits ICRAC in the TRPC heptaKO cells, in line with the known effects of 2APB on CRAC currents in cells expressing Orai1. ICRAC is slightly enhanced immediately following 2-APB administration and this is followed by inhibition of current. (C) Both WT and TRPC heptaKO cells show characteristic CDI (Ca2-dependent inhibition) of CRAC currents. The traces show CRAC currents during hyperpolarizing steps (300 ms) to −100 mV in the presence of either 20 mM Ca2+o or of DVF solution. CDI is absent in DVF solution indicating that the process is Ca2+-dependent. (D) Summary graphs showing the current densities of ICRAC in 20 mM Ca2+o and in DVF solutions in WT and TRPC heptaKO cells. The current densities of WT and TRPC heptaKO cells in 20 mM Ca2+o are −1.41 ± 0.14 pA/pF (n = 8) and −1.8 ± 0.14 pA/pF (n = 28), respectively (P > 0.05); in the presence of DVF, the current densities are −10.6 ± 1.27 pA/pF (WT, n = 5) and −10.5 ± 0.97 pA/pF (TRPC heptaKO, n = 24), respectively (P > 0.05). Values are mean ± SEM. Mouse CD4 T cells were isolated from the spleen and activated with anti-CD3 and anti-CD28 antibodies for 3 d as described above in Materials and Methods. Analysis of current amplitudes was performed by measuring the peak currents during the 100-ms pulse to −100 mV. For the bar graphs shown, current amplitudes were determined by averaging the maximal current densities in each cell. Averaged results are presented as the mean value ± SEM. Statistical comparisons were performed using unpaired t tests.
Fig. 12.
Fig. 12.
Inhibition of ROCE and SOCE by CRAC-inhibitor GSK7975A. The figure shows the inhibition of ROCE and SOCE in wt and HeptaKO MEF cells and in human HEK293 cells, all transfected with the rat muscarinic M5 acetyl choline Receptor.

References

    1. Hou X., Pedi L., Diver M. M., Long S. B., Crystal structure of the calcium release-activated calcium channel Orai. Science 338, 1308–1313 (2012). - PMC - PubMed
    1. Liao Y., Abramowitz J., Birnbaumer L., The TRPC family of TRP channels: Roles inferred (mostly) from knockout mice and relationship to ORAI proteins. Handb. Exp. Pharmacol. 223, 1055–1075 (2014). - PubMed
    1. Liao Y., et al. , Orai proteins interact with TRPC channels and confer responsiveness to store depletion. Proc. Natl. Acad. Sci. U.S.A. 104, 4682–4687 (2007). - PMC - PubMed
    1. Liao Y., et al. , Functional interactions among Orai1, TRPCs, and STIM1 suggest a STIM-regulated heteromeric Orai/TRPC model for SOCE/Icrac channels. Proc. Natl. Acad. Sci. U.S.A. 105, 2895–2900 (2008). - PMC - PubMed
    1. Liao Y., et al. , A role for Orai in TRPC-mediated Ca2+ entry suggests that a TRPC: Orai complex may mediate store and receptor operated Ca2+ entry. Proc. Natl. Acad. Sci. U.S.A. 106, 3202–3206 (2009). - PMC - PubMed

MeSH terms

LinkOut - more resources