. 2025 Jan 1;36(1):br2.
doi: 10.1091/mbc.E24-06-0241. Epub 2024 Nov 27.

Macrophage subtypes inhibit breast cancer proliferation in culture

Affiliations

Macrophage subtypes inhibit breast cancer proliferation in culture

Sophia R S Varady et al. Mol Biol Cell. .

Abstract

Macrophages are a highly plastic cell type that adopt distinct subtypes and functional states depending on environmental cues. These functional states can vary widely, with distinct macrophages capable of displaying opposing functions. We sought to understand how macrophage subtypes that exist on two ends of a spectrum influence the function of other cells. We used a coculture system with primary human macrophages to probe the effects of macrophage subtypes on breast cancer cell proliferation. Our studies revealed a surprising phenotype in which both macrophage subtypes inhibited cancer cell proliferation compared with cancer cells alone. Of particular interest, using two different proliferation assays with two different breast cancer cell lines, we showed that differentiating macrophages into a "protumor" subtype inhibited breast cancer cell proliferation. These findings are inconsistent with the prevailing interpretation that "protumor" macrophages promote cancer cell proliferation and suggest a re-evaluation of how these interpretations are made.


Figures

FIGURE 1:
FIGURE 1:
MDA-MB-231 breast cancer cells do not exhibit increased cell number when in culture with M2-like macrophages. (A) Schematic outlining coculture approaches. (B) Example gating of Ki67 cell cycle index flow cytometry assays. (C–F) Quantification of MDA-MB-231 cells in each stage of the cell cycle at 48 h (C) and 72 h (E), following gating strategies outlined in B when MDA-MB-231 cells are plated alone (“231 alone”), when MDA-MB-231 cells are plated with M1-like macrophages (“231 + M1 MΦ”) and when MDA-MB-231 cells are plated with M2-like macrophages (“231 + M2 MΦ”) (n = 4 independent PBMC donors). (D, F) Comparison of only the G2/M phase of the cell cycle from data in C at 48 h and data in E at 72 h (n = 4 independent PBMC donors; Tukey's one-way ANOVA). (G) Representative example of MDA-MB-231 cell confluence over 72 h when MDA-MB-231 cells are plated under conditions described in C, plus MDA-MB-231 cells plated alone at double density (“231 2x alone”). (H) Quantification of MDA-MB-231 cell confluence at 72 h in G, reported as the fold increase in cell area (measured by phase-contrast imaging – see Materials and Methods) over time (n = 4 independent PBMC donors; Tukey's one-way ANOVA).
FIGURE 2:
FIGURE 2:
M2-like macrophages maintain their differentiation state over the experimental time course and do not induce MDA-MB-231 cell death. (A–C) Quantification of CD206+ macrophages across culture conditions. Quantification of the percent of CD206+ macrophages measured by surface CD206 expression at 24 h (A), 48 h (B), and 72 h (C) of culture when M1-like macrophages are plated alone (“M1 MΦ alone”) when M1-like macrophages are plated with MDA-MB-231 cells (“231 + M1 MΦ”), when M2-like macrophages are plated alone (“M2 MΦ alone”), and when M2-like macrophages are plated with MDA-MB-231 cells (“231 + M2 MΦ”) (n = 4 independent PBMC donors; Tukey's one-way ANOVA). (D–F) Quantification of Annexin V positive MDA-MB-231 cells at 24 h (D), 48 h (E), and 72 h (F) when MDA-MB-231 cells are plated as described in A–C. The positive control is heat-killed cells (see Materials and Methods) (n = 3 independent PBMC donors; Tukey's one-way ANOVA). Analysis was performed on the same day for each biological replicate; thus, the same positive control was used for all timepoints.
FIGURE 3:
FIGURE 3:
M2-like macrophages inhibit MDA-MB-468 proliferation. (A–D) Quantification of MDA-MB-468 cells in each stage of the cell cycle at 48 h (A) and 72 h (C) when MDA-MB-468 cells are plated alone (“468 alone”) when MDA-MB-468 cells are plated with M1-like macrophages (“468 + M1 MΦ”) and when MDA-MB-468 cells are plated with M2-like macrophages (“468 + M2 MΦ”) (n = 4 independent PBMC donors). (B, D) Comparison of only the G2/M phase of the cell cycle from data in A at 48 h and data in C at 72 h (n = 4 independent PBMC donors; Tukey's one-way ANOVA). (E) Representative example of MDA-MB-468 cell confluence over 72 h when MDA-MB-468 cells are plated as in A with MDA-MB-468 cells plated alone at double density (“468 2x alone”). (F) Quantification of MDA-MB-468 cell confluence at 72 h in E, reported as the fold increase in cell area over time (n = 4 independent PBMC donors; Tukey's one-way ANOVA).
FIGURE 4:
FIGURE 4:
Conditioned media from M2-like macrophages increases MDA-MB-468 proliferation compared with conditioned media from M1-like macrophages. (A) Representative example of proliferation of MDA-MB-231 cell confluence over 72 h when naïve MDA-MB-231 cells are treated with conditioned media from M2-like macrophages alone (“M2 alone CM”), when naïve MDA-MB-231 cells are treated with conditioned media from MDA-MB-231/M2-like cocultures (“231 + M2 CM”), when naïve MDA-MB-231 cells are treated with conditioned media from M1-like macrophages alone (M1 alone CM), and when naïve MDA-MB-231 cells are treated with conditioned media from MDA-MB-231/M1-like macrophage cocultures (“231 + M1 CM”). (B) Quantification of MDA-MB-231 cell confluence at 48 h when treated with conditioned media from M1-like or M2-like macrophages alone (A) (n = 4 independent PBMC donors; Mann–Whitney test). (C) Quantification of MDA-MB-231 cell confluence at 72 h when treated with conditioned media from MDA-MB-231/M1-like or MDA-MB-231/M2-like macrophage cocultures in A (n = 5 independent PBMC donors; Mann–Whitney test). (D) Representative example of the proliferation of MDA-MB-468 cell numbers over 72 h when naïve MDA-MB-468 cells are treated as described in A. (E) Quantification of MDA-MB-468 cell confluence at 72 h when treated with conditioned media from M1-like or M2-like macrophages alone in D (n = 5 independent donors; Mann–Whitney test). (F) Quantification of MDA-MB-468 cell confluence at 72 h when treated with conditioned media from MDA-MB-468/M1-like or MDA-MB-468/M2-like macrophage cocultures in (D) (n = 5 independent PBMC donors; Mann–Whitney test).
FIGURE 5:
FIGURE 5:
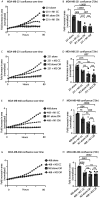
Conditioned media from M2-like macrophages inhibit breast cancer cell proliferation compared with cancer cells alone. (A) Representative example of the proliferation of MDA-MB-231 cell numbers over 72 h when naïve MDA-MB-231 cells are treated with conditioned media from MDA-MB-231 cells alone (“231 alone”), when MDA-MB-231 cells are in direct coculture with M1-like macrophages (“231 + M1 CC”), when naïve MDA-MB-231 cells are treated with conditioned media from M1-like macrophages alone (“M1 alone CM”), and when naïve MDA-MB-231 cells are treated with conditioned media from MDA-MB-231/M1-like macrophage cocultures (“231 + M1 CM”). (B) Quantification of MDA-MB-231 cell confluence at 72 h when plated in conditions listed in (A) (n = 4 independent PBMC donors; Tukey's one-way ANOVA). (C) Representative example of the proliferation of MDA-MB-231 cell numbers over 72 h when naïve MDA-MB-231 cells are treated with conditions described in A, but with M2 macrophages. (D) Quantification of MDA-MB-231 cell confluence at 72 h when plated in conditions listed in C (n = 4 independent PBMC donors; Tukey's one-way ANOVA). (E) Representative example of the proliferation of MDA-MB-468 cell numbers over 72 h when naïve MDA-MB-468 cells are treated with conditions described in A. (F) Quantification of MDA-MB-468 cell confluence at 72 h when plated in conditions listed in E (n = 5 independent PBMC donors; Tukey's one-way ANOVA). (G) Representative example of the proliferation of MDA-MB-468 cell numbers over 72 h when naïve MDA-MB-468 cells are treated with conditions described in C. (H) Quantification of MDA-MB-468 cell confluence at 72 h when plated in conditions listed in G (n = 5 independent PBMC donors; Tukey's one-way ANOVA).

Update of

References

    1. Azizi E, Carr AJ, Plitas G, Cornish AE, Konopacki C, Prabhakaran S, Nainys J, Wu K, Kiseliovas V, Setty M, et al. (2018). Single-cell map of diverse immune phenotypes in the breast tumor microenvironment. Cell 174, 1293–1308.e36. - PMC - PubMed
    1. Boutilier AJ, Elsawa SF (2021). Macrophage polarization states in the tumor microenvironment. Int J Mol Sci 22, 6995. - PMC - PubMed
    1. Carroll MJ, Kapur A, Felder M, Patankar MS, Kreeger PK (2016). M2 macrophages induce ovarian cancer cell proliferation via a heparin binding epidermal growth factor/matrix metalloproteinase 9 intercellular feedback loop. Oncotarget 7, 86608–86620. - PMC - PubMed
    1. Cassetta L, Pollard JW (2020). Tumor-associated macrophages. Curr Biol 30, R246–R248. - PubMed
    1. Cendrowicz E, Sas Z, Bremer E, Rygiel TP (2021). The Role of macrophages in cancer development and therapy. Cancers (Basel) 13, 1946. - PMC - PubMed

LinkOut - more resources