. 2024 Nov 29;10(48):eadq3350.
doi: 10.1126/sciadv.adq3350. Epub 2024 Nov 27.

Inflammatory cytokines disrupt astrocyte exosomal HepaCAM-mediated protection against neuronal excitotoxicity in the SOD1G93A ALS model

Affiliations

Inflammatory cytokines disrupt astrocyte exosomal HepaCAM-mediated protection against neuronal excitotoxicity in the SOD1G93A ALS model

Shijie Jin et al. Sci Adv. .

Abstract

Astrocyte secreted signals substantially affect disease pathology in neurodegenerative diseases. It remains little understood about how proinflammatory cytokines, such as interleukin-1α/tumor necrosis factor-α/C1q (ITC), often elevated in neurodegenerative diseases, alter astrocyte-secreted signals and their effects in disease pathogenesis. By selectively isolating astrocyte exosomes (A-Exo.) and employing cell type-specific exosome reporter mice, our current study showed that ITC cytokines significantly reduced A-Exo. secretion and decreased spreading of focally labeled A-Exo. in diseased SOD1G93A mice. Our results also found that A-Exo. were minimally associated with misfolded SOD1 and elicited no toxicity to mouse spinal and human iPSC-derived motor neurons. In contrast, A-Exo. were neuroprotective against excitotoxicity, which was completely diminished by ITC cytokines and partially abolished by SOD1G93A expression. Subsequent proteomic characterization of A-Exo. and genetic analysis identified that surface expression of glial-specific HepaCAM preferentially mediates A-Exo's axon protection effect. Together, our study defines a cytokine-induced loss-of-function mechanism of A-Exo. in protecting neurons from excitotoxicity in amyotrophic lateral sclerosis.


Figures
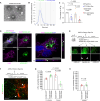
Fig. 1.
Fig. 1.. Proinflammatory cytokines reduce secretion of A-Exo. and in vivo spreading along spinal cords of SOD1G93A mice.
(A) Representative immunoEM images of mouse (m)CD63 labeling in A-Exo. White arrows, CD63+ A-Exo.; scale bar, 100 nm. (B) Representative size distribution of A-Exo from untreated and cytokine (ITC)–treated NTg astrocyte cultures. (C) Relative fold change of NTA measured exosomes from untreated control and ITC cytokine–treated NTg and SOD1G93A astrocyte cultures. A-Exo. were SEC purified from ACM (20 ml per sample) and analyzed using ZetaView NTA. Astrocytes were all ~90 to 95% confluent. n = 6 to 8 biological replicates/group. (D) Representative images [scale bars, (i) 20 μm and (ii to v) 10 μm] and orthogonal views (XZ and XY) of hCD63-GFP (green) and RAB7 (purple) in NTg astrocyte cultures. White arrows, colocalizations of hCD63-GFP and RAB7. (E) Schematic view of AAV5-mCherry-Gfap-Cre injection into spinal cords of hCD63-GFPf/+SOD1G93A+ and hCD63-GFPf/+ mice and representative images of induced hCD63-GFP and mCherry reporter signals (indication of AAV5 spreading) in proximal and distal sections from the injection site. Scale bar, 200 μm. (F) Schematic view of AAV5-mCherry-Gfap-Cre injection into spinal cords of hCD63-GFPf/+Ai14-tdTf/+ mice and a representative image of induced hCD63-GFP and tdTomato reporter signals. White arrows, tdT+ astrocytes; scale bar, 20 μm. Quantification of the spreading distance of hCD63-GFP+ signal along spinal cords in AAV5-mCherry-Gfap-Cre (G) or AAV8-mCherry-CaMKIIa-Cre (H) injected mice. n = 4 mice per group for disease progression stage (P105 to P115, injected at P90 to P100); n = 3 mice per group for pre-disease stage (P75 to P80, injected at P60). Error bars denote SEM, and P values were calculated using one-way analysis of variance (ANOVA) followed by a Tukey post hoc test in (C) and (G) and unpaired t test in (H).
Fig. 2.
Fig. 2.. Misfolded SOD1 proteins are minimally associated with SOD1G93A A-Exo. and N-Exo. in vitro and in vivo.
(A) Representative immunoblots of hSOD1G93A and misfolded SOD1 in eluted SEC fractions (pooled as indicated) of SOD1G93A ACM (10 ml). Thirty microliters of pooled fractions per lane were loaded. (B) Representative immunoblots of hSOD1G93A and misfolded SOD1 on SOD1G93A A-Exo. (2 μg per lane) isolated from ACM of untreated and ITC cytokine–treated SOD1G93A astrocytes. (C) Representative immunoblots of hSOD1G93A and misfolded SOD1 in eluted SEC fractions (pooled as indicated) of SOD1G93A NCM. Thirty microliters of pooled fractions per lane were loaded. Red dashed box highlights exosome fractions as determined by the exosome marker CD81. Representative confocal microscopy images of hCD63-GFP+ and misfolded SOD1 detected by either SEDI (D) or A5C3 (E) antibody from spinal cords of AAV5-mCherry-Gfap-Cre–injected hCD63-GFPf/+SOD1G93A+ mice. [(ii) and (iii)] Two magnified fields from (i); scale bars, 20 μm. Sections used were ~1500 μm from the injection site with no mCherry signals. (F) Percentage of colocalization of hCD63-GFP+ puncta signal with misfolded SOD1 detected by either A5C3 or SEDI antibody from spinal cords of AAV5-mCherry-Gfap-Cre–injected hCD63-GFPf/+SOD1G93A+ mice. n = 12 to 21 sections from 4 mice per group. Representative confocal microscopy images of hCD63-GFP+ and misfolded SOD1 detected by either SEDI (G) or A5C3 (H) antibodies from spinal cords of AAV8-mCherry-CaMKIIa-Cre–injected hCD63-GFPf/+SOD1G93A+ mice. [(ii) and (iii)] Two magnified fields from (i); scale bars, 20 μm. Sections used were ~1000 μm from the injection site with no mCherry signals. (I) Percentage of colocalization of hCD63-GFP+ puncta signal with misfolded SOD1 detected by either A5C3 or SEDI antibody from spinal cords of AAV8-mCherry-CaMKIIa-Cre–injected hCD63-GFPf/+SOD1G93A+ mice. n = 17 sections per three mice.
Fig. 3.
Fig. 3.. A-Exo. from untreated and ITC cytokine–treated NTg and SOD1G93A astrocyte cultures elicit no toxicity to primary spinal MNs.
(A) Representative images of cultured spinal MNs immunostained with TUNEL, ChAT, and Hoechst 33342. White arrows, TUNEL-positive MNs; scale bar, 50 μm. TUNEL assay–based quantification of apoptotic SOD1G93A (B) and SOD1G93A+ (C) spinal MNs following treatment with 1× PBS (control), NTg, SOD1G93A, ITC-NTg, or ITC-SOD1G93A A-Exo, respectively. Spinal MN death rate was calculated by dividing TUNEL+ChAT+Hoechst+ neurons by total ChAT+Hoechst+ neurons. n = 22 to 40 fields (20×) from two biological replicates per group. Data are presented in violin plots. The lines in each violin plot indicate 75% quantile, median, and 25% quantile (from top to bottom). One microgram of A-Exo. was used in each treatment in (B) and (C). P values were calculated using one-way ANOVA followed by a Tukey post hoc test. (D) Representative image of ChAT+HB9-eGFP+ MNs in spinal cord neuronal cultures. Scale bar, 100 μm. Survival rate of HB9-eGFP+SOD1G93A (E) and HB9-eGFP+SOD1G93A+ (F) spinal MNs following treatment with 1× PBS (control), NTg, or SOD1G93A A-Exo. n = 3 to 5 independent samples with ~300 MNs per sample at DIV 3. Error bars denote SEM, and P value determined by two-way ANOVA, F1,30 = 4.36 and Sidak post hoc analysis.
Fig. 4.
Fig. 4.. ITC cytokine treatment diminishes NTg A-Exo.–mediated protection against neuronal excitotoxicity in cortical neurons and in human iPSC–derived MNs
(A) Cortical neuronal death rate following treatment with l-Glu. (100 or 1000 μM) and l-Glu. + NTg A-Exo. (1 μg). n = 23 to 31 fields (20×) per three biological replicates per group; Control, untreated cultures. Neuronal death rate was calculated by TUNEL+Hoechst+ neurons divided by Hoechst+ neurons. Representative images (B) of βIII-TUBULIN staining and quantification (C) of neurite beading in cortical neurons following the same treatment. White arrows in (ii), (iii), and (vi) indicate neurite beading; scale bar, 50 μm. Neurite beading index was calculated by the total number of “beads” per field (20×) divided by the βIII-TUBULIN+ area in the same field. n = 23 to 31 fields (20×) per three biological replicates per group. (D) Schematic diagram of treatment of neuronal cultures with l-Glu. and A-Exo. (1 μg) collected from different genotype and ITC treatment combination. (E) Cortical neuronal death rate treated with l-Glu. (100 μM), l-Glu. + NTg or SOD1G93A A-Exo., l-Glu. + ITC-NTg, or ITC-SOD1G93A A-Exo. n = 11 to 26 fields (20×) per two biological replicates per group. All legends are shown (and the same as) in (F) due to limited space. (F) Quantification of neurite beading in cortical neurons following the same treatment as indicated in (E). n = 27 to 33 fields (20×) per three biological replicates per group. (G) Quantification of neurite beading in human iPSC–derived MNs treated with l-Glu. (200 μM) and combinations of l-Glu. with different A-Exo. (2 μg). n = 26 to 48 fields (20×) per three biological replicates per group. Data from different fields of the same biological replicate were averaged and presented in each panel. Error bars denote SEM, and P values in (E) to (G) were calculated using one-way ANOVA followed by a Tukey post hoc test. P values in (A) and (C) were calculated using two-way ANOVA followed by a Tukey post hoc test. A.U., arbitrary units.
Fig. 5.
Fig. 5.. ITC cytokine treatment and expression of SOD1G93A differentially alters protein cargoes in A-Exo.
(A) Exosomes were isolated from untreated and ITC cytokine–treated primary NTg and SOD1G93A astrocyte cultures for LC-MS/MS proteomic analysis. Three-way Venn diagrams of proteins that were up-regulated (B) and down-regulated (C) in A-Exo. from astrocyte cultures treated with ITC cytokines and SOD1G93A expression. Fold change > or < 1.5 was used as the cutoff to identify changed proteins either by ITC treatment or SOD1G93A expression. The number of proteins that are overlapped in each comparison was highlighted in the diagram. Black arrows indicate either up- or down-regulated proteins in A-Exo from each comparison, presented as the numerator divided by the denominator. (D) Cellular location of proteins up-regulated with cytokine stimulation in NTg and SOD1G93A (co–up-regulated) and down-regulated with cytokine stimulation in NTg and SOD1G93A (co–down-regulated). (E) Heatmap of co–up-regulated and co–down-regulated plasma membrane proteins. Values are Log2(averaged iBAQ values). Representative immunoblot (F) and quantification (G) of HepaCAM protein in NTg, ITC-NTg, SOD1G93A, and ITC-SOD1G93A A-Exo. based on total loaded protein (gel staining intensity, 2 μg per lane); n = 5 to 6 independent samples per group. Representative HepaCAM immunoblot (H) and quantification (I) from lumbar spinal cords of SOD1G93A (onset, P90 to P100; mid-disease, P110 to P120) and age-matched NTg mice. N = 5 to 9 mice per group. β-Actin was used as the control for normalization. Error bars denote SEM, and P values are calculated using one-way ANOVA followed by a Tukey post hoc test in (G) and (I).
Fig. 6.
Fig. 6.. HepaCAM preferentially mediates A-Exo.’s protection against glutamate-induced neurite degeneration.
Cortical neuronal death rate (A) and neurite beading index (B) in primary cortical neurons treated with l-Glu (100 μM), NTg A-Exo. + l-Glu, HepaCAM KO A-Exo. + l-Glu, HepaCAM KO + HepaCAM overexpression (OE) A-Exo. + l-Glu. Control, 1× PBS; n = 24 to 31 fields (20×) per three biological replicates per group for neuronal death rate. n = 24 to 38 fields (20×) per three biological replicates per group for neurite beading analysis. (C) Representative images of βIII-TUBULIN and TUNEL staining in primary cortical neurons grown on PDL + BSA or PDL + HepaCAM ECD and treated with l-Glu. (100 μM). White arrows, neurites with beading; yellow arrows, preserved axons with minimal beading. (ii) A magnified view from the box in (i); (v) a magnified view from the box in (iv); circles indicate TUNEL+ neurons in (iii). Scale bar, 30 μm [(i), (iii), (iv), and (vi)]; 20 μm [(ii) and (v)]. Cortical neuronal death rate (D) and neurite beading index (E) in primary cortical neurons grown on PDL + BSA or PDL + HepaCAM ECD and treated with l-Glu. (100 μM). n = 29 to 32 fields (20×) per three biological replicates per group for neuronal death rate. n = 18 to 26 fields (20×) per two biological replicates per group for neurite beading analysis. Data from different fields of the same biological replicate were averaged and presented in each panel. Error bars denote SEM, and P values in (A), (B), (D), and (E) were calculated using one-way ANOVA followed by a Tukey post hoc test.
Fig. 7.
Fig. 7.. Local and direct A-Exo. HepaCAM signaling to axons contributes to A-Exo.’s protection against excitotoxic axon degeneration.
(A) Schematic representation of the microfluidic chamber system and representative images of the soma and axonal compartments. (i) Differential interference contrast (DIC) image of neurons at the soma side; (ii) DIC image of axons at the axon side; (iii) tdT+-labeled neurons by adding AAV8-CAG-tdT onto the soma side of the chamber at 10 DIV; (iv) tdT+-labeled axons at the axon side of the chamber; white lines and gray arrows indicate the ending of the soma side (i) and the beginning of the axon side (ii) of the chamber. Scale bar, 100 μm. Representative images (B) of tdT+ axon degeneration and quantification (C) of axonal tdT+ intensity over time following addition of l-Glu. into either soma or axon sides. White arrows, degenerating axons indicated by beading following soma side of l-Glu. treatment; yellow arrows, healthy axons even after l-Glu. treatment at the axon side; scale bar, 50 μm; n = 19 to 30 fields (10×) per three chambers per two biological replicates per group. Diagram of the experiment and representative tdT+ axon images (D) and tdT+ intensity quantification (E) at the axon side of the microfluidic chambers. l-Glu was added onto the soma side and all A-Exo. (NTg and HepaCAM A-Exo.) were added onto the axon side. White lines and gray arrows indicate the beginning of the axon side of the chamber. HepaCAM ECD was coated on microfluidic chambers. Time-lapse tdT+ images were taken at 0-, 6-, and 22-hours after l-Glu. treatment, and the tdT fluorescent intensity was quantified. n = 19 to 39 fields (10×) per four chambers per two biological replicates per group; white arrows, degenerating axons; yellow arrows, healthy axons; scale bar, 50 μm. Error bars denote SEM. P values were calculated using two-way ANOVA followed by a Tukey post hoc test.

References

    1. De Vos K. J., Hafezparast M., Neurobiology of axonal transport defects in motor neuron diseases: Opportunities for translational research? Neurobiol. Dis. 105, 283–299 (2017). - PMC - PubMed
    1. Morrison B. M., Lee Y., Rothstein J. D., Oligodendroglia: Metabolic supporters of axons. Trends Cell Biol. 23, 644–651 (2013). - PMC - PubMed
    1. Nave K. A., Myelination and support of axonal integrity by glia. Nature 468, 244–252 (2010). - PubMed
    1. Rigby M. J., Gomez T. M., Puglielli L., Glial cell-axonal growth cone interactions in neurodevelopment and regeneration. Front. Neurosci. 14, 203 (2020). - PMC - PubMed
    1. Rabin S. J., Kim J. M., Baughn M., Libby R. T., Kim Y. J., Fan Y., Libby R. T., La Spada A., Stone B., Ravits J., Sporadic ALS has compartment-specific aberrant exon splicing and altered cell-matrix adhesion biology. Hum. Mol. Genet. 19, 313–328 (2010). - PMC - PubMed